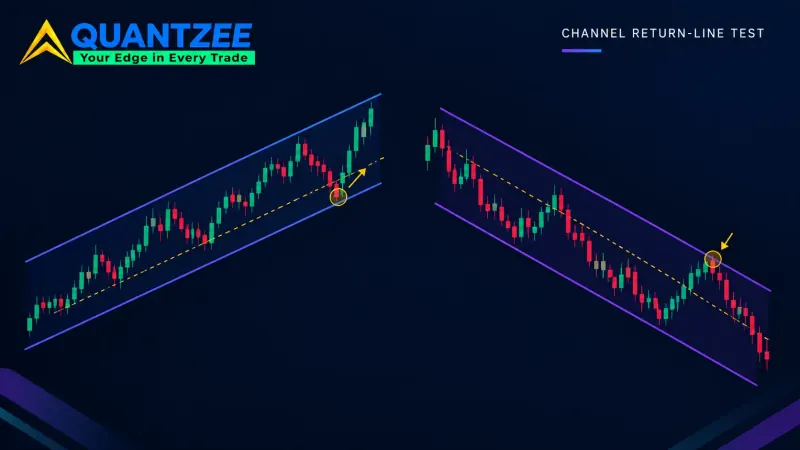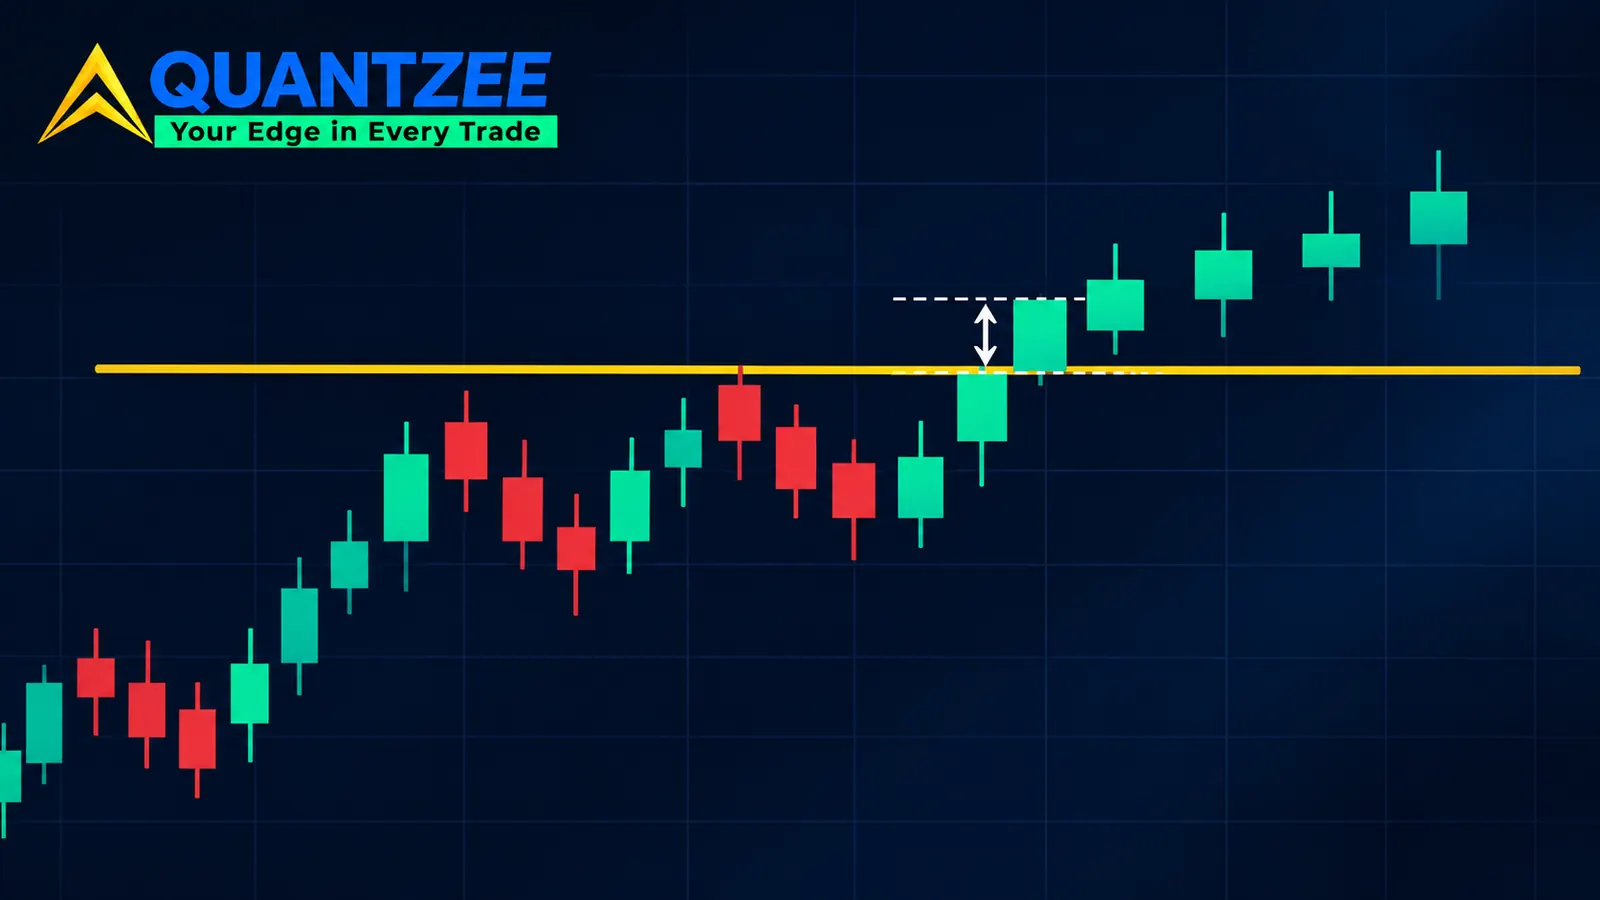
What is a breakout? A breakout is a close beyond a support or resistance level that the market then holds. That's the short answer, but it only becomes usable once you fix three numbers: what counts as "beyond" (a close, not a wick), how far beyond (measured in volatility units, not cents), and for how long (a count of whole bars). Skip any one of the three and the word means whatever you want it to mean after the fact.
Most pages that rank for this question stop at the first sentence. They define the move, warn you about false breakouts, and never say what "past the level" actually means. This piece gives you a pass/fail test for each stage, so you can open a chart today and grade a break while it's still forming. It's how we approach every setup at Quantzee: a pattern is a set of thresholds you can type into a chart, not a picture you recognise.
What is a breakout, stated as a test?
Here's the definition we work from. A breakout is a candle that closes beyond a level, by at least a set fraction of average true range, followed by a set number of further closes that stay beyond it. That gives you three inputs and three checks, and a move that fails any one of them is not a breakout yet, only a probe.
That framing matters because the opposite event looks identical for the first few seconds: price pushes through a prior high, stops trigger, volume spikes. Whether that turns into a trend or a reversal depends on what happens at the close and on the bars that follow. The three tests below are simply a way of writing down what you were going to judge by eye anyway.
Test 1: a close beyond the level, not a wick beyond it
A wick through a level that closes back inside is not a weak breakout. It's a different event entirely, where buyers or sellers tried, filled the resting orders, and lost. The bar's close is the market's vote on where price belongs, and it voted for inside the range.
So the first check is binary: did the bar close beyond the level? If not, stop, and don't call it anything yet.
The wick-through, close-back-inside case has its own rulebook. We broke it down in the four-bar liquidity sweep test, which grades the penetration wick, the rejection close and the displacement bar one at a time. Think of that page and this one as mirror images, because a sweep fails Test 1 on purpose while a breakout has to pass it.
One practical detail is to decide your timeframe before you look, since a 5-minute close beyond a daily level is not the same as a daily close beyond it. Grade the break on the timeframe the level was drawn on, or one step below at most.
Test 2: penetration depth in ATR units, not cents
"Price closed $0.20 above resistance" tells you nothing. On a $15 stock that barely moves, $0.20 might be a real push, while on a $600 index ETF it's rounding noise. A fixed cent or pip distance can't travel across instruments, and it can't even travel across quiet and busy weeks on the same instrument.
The fix is to measure depth as a fraction of average true range (ATR). True range is the largest of three gaps: today's high minus low, today's high minus yesterday's close, and yesterday's close minus today's low. According to TradingView's ATR documentation, the standard indicator averages that over 14 periods using Wilder's smoothing (RMA). That's the setting we use for every number in this article: ATR length 14, RMA smoothing, same timeframe as the chart.
Then the depth test reads like this: the breakout close must sit at least k × ATR beyond the level. You pick k, and here's how the choice behaves:
- k = 0.1 accepts almost any close beyond the line. You'll catch nearly every real break and a large share of the noise with it.
- k = 0.25 is a reasonable place to start testing on liquid instruments. It filters closes that barely kiss the level.
- k = 0.5 demands a decisive bar. Fewer signals, and you'll often enter after a meaningful part of the first leg is gone.
None of those is a magic number, because they're dials rather than rules. The ATR unit is what makes the dial portable: a 0.25 × ATR rule means the same thing on a currency pair, a futures contract and a small-cap stock, which a $0.20 rule never will.
Our own gap research uses the same unit for the same reason. In the breakaway gap study, gaps under 0.5x the 14-day ATR filled intraday 71% of the time in our data, while gaps between 0.5x and 1.5x ATR held beyond the prior range through the first hour in 58% of cases. Different event, same lesson: size only means something relative to normal range.
Test 3: hold time, counted in whole bars
A single close beyond the level is evidence, while two or three closes in a row is a breakout. The question is how many you require, and the honest answer is that it's a trade-off, not a constant.
Require 1 bar and you get in early, with the highest false-break rate. Require 3 bars and many failed breaks will have already reversed before you commit, but your entry sits further from the level and your stop gets wider. Every extra bar of confirmation buys a lower false-break rate with signal count and entry price.
We saw that trade-off in plain numbers when we compared opening ranges. The 5, 15 and 30-minute ORB comparison found that shorter windows traded more often with worse odds per trade, and longer windows traded less often with better odds. Hold-time works the same way. There's no setting that wins on every axis, so pick the one that fits your stop size and how many signals you can actually manage.
Count whole bars only, so "it's been beyond the level for most of this candle" doesn't count, because the bar either closes beyond the level or it doesn't.
Volume: a multiple of average, and nobody publishes which one
Every breakout guide says to look for "higher volume," but very few say higher than what, or by how much. The sensible form of the rule is a multiple of a rolling average: breakout-bar volume divided by the 20 or 50-bar average volume.
What we can't give you is one universal multiple, because nobody on page one has measured one either. We did measure it inside specific patterns. When we counted 412 cup and handle formations on US large-cap and index names from 2019 through 2025, we used a 1.5x confirmation threshold against the 50-day average (the cup and handle failure-rate page has the full method). The numeric VCP definition uses 1.4x the 50-day average, and we found that bases breaking out below 1.0x failed close to 60% of the time in that sample.
Those are pattern-specific results, and they don't automatically transfer to a horizontal level on a 15-minute chart. To produce a general figure, you'd need to fix the instrument, the timeframe, a date range of at least a few years, and a sample of a few hundred breaks graded by the three tests above. Until someone publishes that, treat any single "2x volume" claim as a starting guess, not a fact.
Where the level came from changes how it fails
A breakout is only as clean as the level it breaks. Three common sources fail in different ways:
Horizontal levels (prior highs, lows, ranges) are the easiest to grade. The line doesn't move, so Tests 1 to 3 apply as written. Their weakness is crowding: the more obvious the level, the more stops rest just past it, and the more likely the first push is a sweep.
Trendlines move with every bar, which makes "closed beyond" depend on exactly how you drew the line. Two traders can disagree about whether the same candle broke out. Draw the line from closes rather than wicks if you want the test to be repeatable.
Pattern boundaries add timing. A symmetrical triangle, for example, tends to produce more false breaks in its final third, close to the apex. The symmetrical triangle apex breakout guide covers the tie-breakers and two execution methods for that case. Wedges have their own confirmation logic, laid out in the wedge three-touch rule, and the numeric VCP definition shows how a contraction base turns into a breakout trigger.
Breakout vs breakdown vs gap
A breakdown is just a breakout to the downside: a close below support, by the depth threshold, held for the required bars. The same three tests apply, just flipped.
Gaps are the awkward case, because when price opens beyond a level, there was never a bar that closed inside it and then pushed out. Test 1 is passed before the session even trades, and Test 2 is often passed by a wide margin. That shifts all the weight onto Test 3. A gap through resistance that gets back inside the level during the first hour has failed the hold test, no matter how strong the open looked. For classifying the gap itself while it's still open, use the breakaway gap page linked above.
The breakout types, in one table
The rest of page one leads with this taxonomy. It's useful, but it shouldn't take 3,000 words, and every row still runs through the same three tests.
| Type | What breaks | What to watch |
|---|---|---|
| Upside | Resistance | Close above, depth in ATR, closes held |
| Downside (breakdown) | Support | Same tests, inverted |
| Continuation | A pause inside an existing trend | Break in the trend's direction; flags and pennants |
| Reversal | A level against the prior trend | Needs stricter depth and hold, as the trend fights it |
| Horizontal | A flat range edge | Crowded stops; check for a sweep first |
| Trendline | A sloped line | Line drawn from closes, or the test isn't repeatable |
| Pattern | Triangle, wedge, base boundary | Pattern timing, such as the apex's final third |
How to run the test on your own charts
The point of three numbers is that you can test them. Here's a simple methodology you can finish in a weekend:
- Pick one instrument and one timeframe, and don't mix them, since base rates differ between them.
- Write down your settings: ATR 14 with RMA, a depth of 0.25 × ATR, a hold of 2 closes, and a volume multiple of 1.5x the 20-bar average.
- Use TradingView's bar replay to step through at least 12 months of history, one bar at a time, so you can't see the future.
- Mark every level touch and grade it: passed all three tests, failed one, or never closed beyond.
- After 50 to 100 graded breaks, count how many passing breaks moved at least 1 × ATR further before returning to the level. That's your own base rate.
Then change one dial at a time, for example raising the hold to 3 bars and recounting, and you'll see the trade-off from Test 3 show up in your own numbers. The SEC's investor.gov glossary entry on backtesting is a useful reminder that past results on historical data don't promise future ones, and FINRA's day trading guidance is worth reading before acting on any short-timeframe signal.
Quantzee's AI Adaptive Quant Toolkit plots ATR-relative context and level structure on TradingView, which makes the grading faster. It's analytical software, not a signal service, so the judgement and the risk stay with you. Paper trade first, on the exact settings you tested, before you size anything real.