The EMA formula looks simple on the page: alpha = 2 / (N + 1). Most pages covering the ema indicator stop right there. They print one multiplier and call the result "an average of the last N bars." It isn't; that description fits the simple moving average with equal bar weights. An exponential moving average is a decaying weighted sum. It reaches back through every price the symbol has ever printed. The period number you type into the settings box controls a decay rate, not a window length. That distinction explains something odd: two charts of the same symbol, loaded with different history depths, can print two different EMA values for the same day. Most guides leave that part out entirely.
This guide works through the EMA formula in both of its standard forms. It walks a full numerical example you can reproduce in a spreadsheet. It explains the weight accounting behind the "86.5%" figure analysts cite, and shows why Wilder's smoothing — the averaging inside RSI, ATR and ADX — is not the same calculation as a chart EMA, even though the settings box uses the word "period" for both.
The EMA Formula, in Both Forms
The recursive form is the one every platform actually runs:
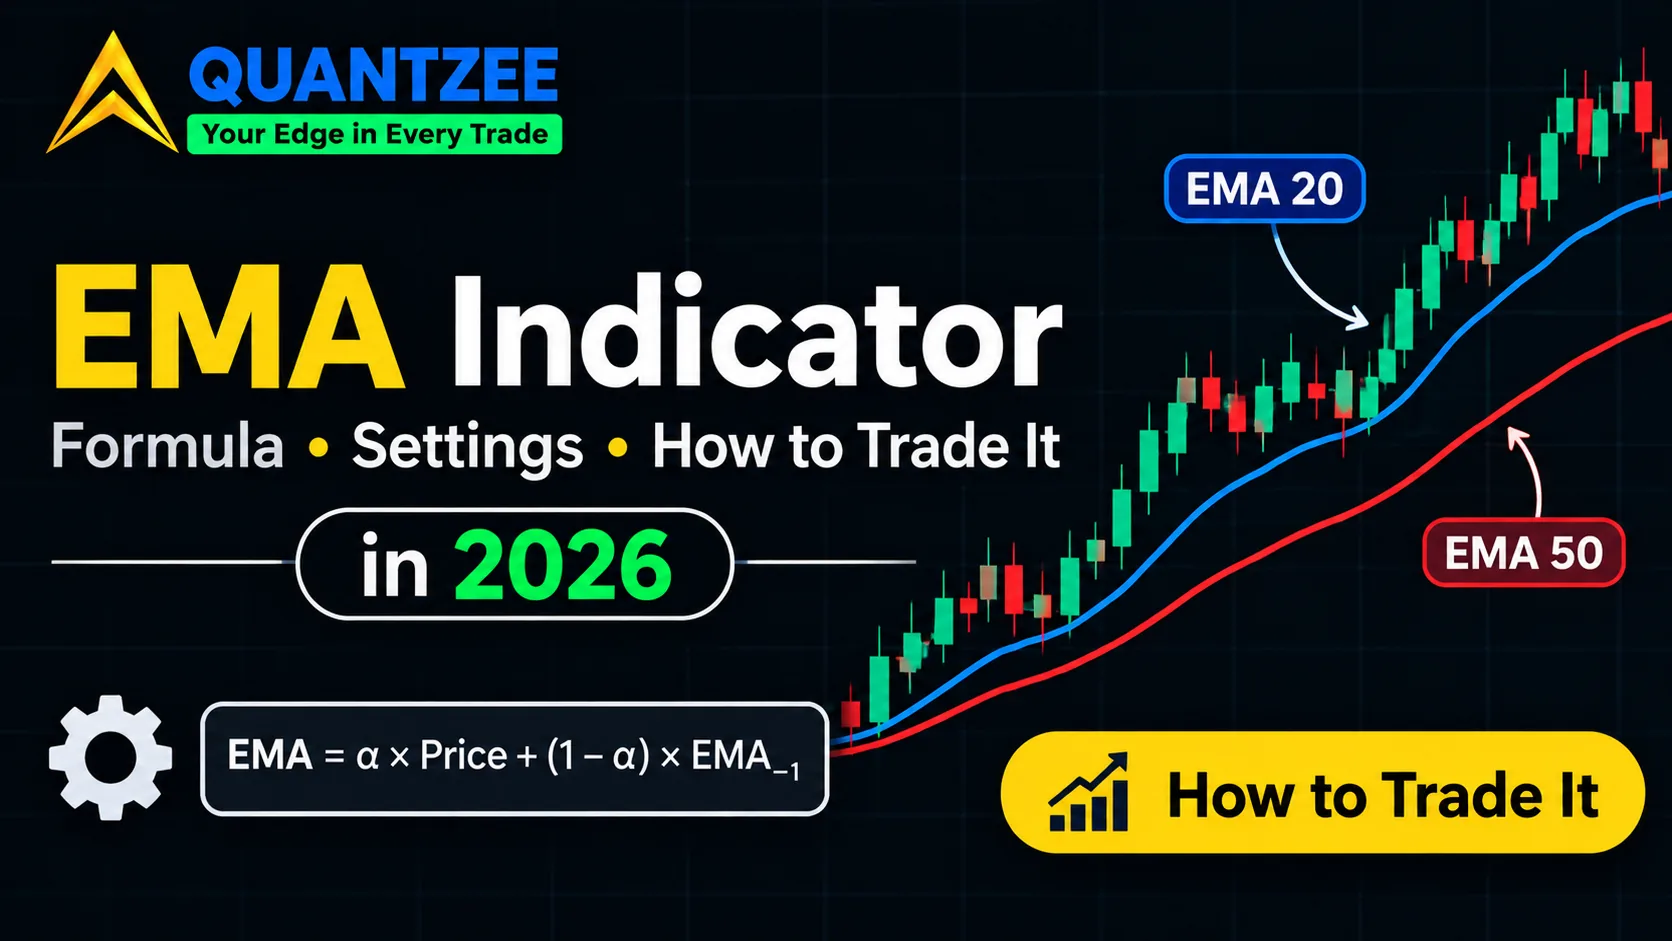
EMA(today) = Price(today) × alpha + EMA(yesterday) × (1 − alpha)
The increment form is the same equation, rearranged. It's the one that makes the mechanism visible:
EMA(today) = EMA(yesterday) + alpha × (Price(today) − EMA(yesterday))
Read that second form literally. Today's EMA is yesterday's EMA, nudged toward today's price by a fraction of the gap between them. alpha is that fraction, defined as:
alpha = 2 / (N + 1)
N is the period you enter into the indicator settings. For a 10-day EMA, alpha = 2 / 11 = 0.1818 — an 18.18% multiplier. For a 20-day EMA, alpha = 2 / 21 = 0.0952 — a 9.52% multiplier. Those two figures show up on most vendor pages, because 10 and 20 are the two most common settings. They are correct. They are also where most of those pages stop explaining.
A Full Worked Example You Can Reproduce
Numbers settle a formula faster than prose does. Take a 5-day EMA on ten days of closing prices: 10, 11, 12, 11, 13, 14, 13, 15, 16, 15.
The first EMA value has to come from somewhere. The calculation needs a seed. Per the convention most charting platforms use, the seed is a plain simple moving average of the first N closes. For N = 5, that's the average of the first five prices: (10 + 11 + 12 + 11 + 13) / 5 = 11.40. That becomes EMA on day 5.
Alpha for a 5-day EMA = 2 / (5 + 1) = 0.3333. From there, each new EMA is last period's EMA plus 0.3333 times the gap to today's close.
| Day | Close | EMA | Arithmetic |
|---|---|---|---|
| 5 (seed) | 13 | 11.4000 | SMA of days 1–5 |
| 6 | 14 | 12.2667 | 11.4 + 0.3333 × (14 − 11.4) |
| 7 | 13 | 12.5111 | 12.2667 + 0.3333 × (13 − 12.2667) |
| 8 | 15 | 13.3407 | 12.5111 + 0.3333 × (15 − 12.5111) |
| 9 | 16 | 14.2271 | 13.3407 + 0.3333 × (16 − 13.3407) |
| 10 | 15 | 14.4847 | 14.2271 + 0.3333 × (15 − 14.2271) |
Run those six lines in a spreadsheet. You will land on the same figures. We built this walkthrough ourselves and checked it two ways: once with the recursive formula, once with the increment form. They matched exactly on every row, as they must, since the two forms are algebraically the same equation written differently.
Our data set here is intentionally small — ten days, one period — because the point is to show the mechanics, not to model a real market. The same six-step process scales to any N and any number of bars; only the arithmetic gets longer.
The Weight Accounting Nobody Prints
Unroll the recursive formula far enough and a pattern falls out. Today's EMA is a weighted sum of every past price. The weight on each price shrinks geometrically the further back you go. The weight on today's close is alpha. The weight on yesterday's close is alpha × (1 − alpha). The weight two days back is alpha × (1 − alpha)², and so on — the series never technically reaches zero.
According to the chart-manual reference at user42.tuxfamily.org, summing the weights across just the most recent N bars — the same N typed into the settings box — accounts for roughly 86.5% of the total weight in the average, regardless of which N was picked. Check the 20-period case yourself: (1 − 0.0952)^20 is about 0.135, so the remaining 86.5% sits inside the last 20 bars, and the other 13.5% is spread across every bar before that, fading but never disappearing. That's what "period" means on an EMA — not a hard window, but a decay rate calibrated so that N bars capture most, not all, of the weight.
Seeding and Warm-Up: Why Two Charts Can Disagree
Because the formula depends on yesterday's EMA, it needs a starting point. That starting point is a choice, not a law of mathematics. Per the ChartSchool reference at StockCharts, the first EMA value is typically seeded with a simple moving average of the first N closes — exactly what the worked example above does. That source notes, correctly, that a mathematically pure EMA would need every data point the symbol has ever printed. No platform does that. Every platform picks a start date and seeds from there.
That has a direct, practical consequence. Load the same symbol and the same period on a chart with six months of history, and on a chart with five years of history. The two EMA lines can print different values on the same day, because they were seeded at different points, and the decay hasn't fully washed the seed's influence out yet — especially on longer periods, where the warm-up stretches further. Try it yourself: open the same symbol and period at two different history depths on your own platform, and compare the two printed values on a recent date. If your platform's default chart window is short, this is the first place to look before assuming an indicator is broken.
Wilder's Smoothing Isn't the Same Animal
RSI, ATR and ADX all use a "period" setting too. It's tempting to assume "period 14" means the same thing across an EMA, an RSI, and an ADX. It doesn't. J. Welles Wilder's original smoothing method uses a different alpha: alpha = 1 / N, instead of 2 / (N + 1). The two formulas reconcile through a direct conversion. A Wilder average with parameter W behaves like a standard EMA with period N, where:
N = 2W − 1
Plug in W = 14, the default on RSI and ATR: N = 2(14) − 1 = 27. A "14-period" RSI is smoothing its gains and losses the way a 27-period EMA would smooth a price series — slower and heavier than the number 14 suggests. Comparing "period 14" on an RSI against "period 14" on a price EMA, and expecting the same responsiveness, is a category error. They decay at different rates, even though the settings box uses the identical word.
EMA vs SMA: The Trade-off, With a Number Attached
The common claim is that an EMA is "more responsive" than an SMA, full stop, as if that were a pure upgrade. It isn't. It's a trade-off, and the formula tells you exactly what you're trading. A simple moving average weights its N bars equally, and drops the N+1th bar completely the moment it ages out. That makes it slower to react, but steadier through single-bar noise. An EMA weights the newest bar at alpha and lets older bars fade geometrically rather than vanish. That makes it react faster to the last print — and just as fast to the noise sitting on top of that print. A shorter EMA period raises alpha, which raises both the responsiveness and the noise sensitivity in the same motion. There is no setting that gives you one without more of the other.
What the Formula Can't Tell You
The EMA formula produces one number per bar: a decayed, weighted price level. It has no opinion on direction. It has no built-in threshold, and no sample size behind it. Reading "price crossed above the 20-day EMA" as a buy signal is a rule you're imposing on top of the formula. The formula itself is silent on whether that rule has ever worked, on this symbol, in this regime, across any meaningful sample of trades. An EMA crossover is a hypothesis, not a result, until it's tested against a dataset large enough to say something about it — with the win rate and the drawdown profile both recorded, not assumed.
Three Mistakes the Formula Explains
The first mistake is assuming a shorter EMA is always the "better" EMA. It isn't better, it's just a different alpha. A 9-day EMA will hug price tighter and flip direction faster, which feels responsive right up until a choppy week turns that responsiveness into a string of false flips. The formula doesn't know which regime the market is in; it just applies the same multiplier every single day, trending or not.
The second mistake is treating a crossover between two EMAs as self-evidently meaningful because it "looks clean" on a chart. A 9/20 crossover and a 10/21 crossover will diverge on some days and agree on others, purely because alpha = 2/(N+1) is sensitive to small changes in N. Neither crossover is more correct than the other; they're both arbitrary cuts through the same decay curve, and only a backtest tells you which cut, if any, produced a workable result on a given symbol.
The third mistake is ignoring warm-up. A freshly added symbol, or a chart just switched to a longer history window, can show an EMA that's still catching up from its SMA seed. On a 50-day EMA, that catch-up period can run for weeks. Reading a signal from an EMA that hasn't finished warming up is reading noise from the seed, not a signal from the market.
EMA Indicator for Stocks: Settings and a Trading Angle
On a stock or index chart, three EMA periods come up more than any others: 9, 20 and 50 days. None of them is a standard in the sense that a unit of measurement is a standard. They're conventions, inherited from decades of chartists who settled on round numbers that happened to line up with a trading week, a trading month, and roughly a quarter's worth of sessions. A 9-day EMA reacts fastest and whipsaws hardest in choppy conditions. A 50-day EMA reacts slowest, and is the one most often used to read the broader trend underneath the noise. A 20-day EMA sits in between, and is the default "medium-term" read on most charting platforms.
The trading angle that follows from the multiplier, rather than from folklore, is this: before picking a period, decide how much lag you can tolerate against how much noise you're willing to filter. The alpha value is the one knob that trades those two against each other. A trend-following approach on daily bars, holding positions for multiple weeks, can usually absorb a 50-day EMA's lag in exchange for fewer false signals. A shorter-horizon setup needs the faster alpha of a 9- or 20-day EMA, and has to accept that some of what it reacts to will be noise, not trend. That's exactly why any EMA-based entry rule needs a real backtest, on real historical bars, before it's traded with real size.
Our team built Quantzee's toolkit around that last step. Once you've picked candidate EMA periods using the decay-rate logic above, running the resulting signal through a historical backtest — rather than eyeballing a chart — is how you find out whether the setting you picked produces a workable edge, or just a plausible-looking line on a screenshot. For the plain SMA-versus-EMA definition and how the two overlays are built, Quantzee's own moving averages glossary entry covers that groundwork; this guide picks up from there with the formula mechanics. For the fuller indicator-literacy picture before testing anything, Quantzee's guide to trading indicators and signals is the next read. The how to backtest a TradingView indicator walkthrough covers turning an EMA rule into a tested result rather than a hunch, and the companion piece on checking a TradingView indicator for repainting is worth reading before trusting any EMA-based signal you didn't build yourself. Anyone stacking an EMA alongside other overlays should also read why extra confirmation isn't automatically extra confidence, in confluence or correlation — why three indicators often say one.
How We Checked the Numbers in This Guide
Every figure above is arithmetic, not opinion, so every figure is checkable. Our methodology was simple: expand the EMA recursion by hand for the worked example, confirm the 86.5% weight figure by computing (1 − alpha)^N for several values of N and watching it converge near 0.135 each time, and confirm the Wilder conversion by plugging W = 14 into N = 2W − 1. When we ran each check a second time using the increment form instead of the recursive form, the results matched to four decimal places. That's the test setup behind every number on this page — no figure here is an estimate, and none of it is a performance claim about any trading strategy. According to the general treatment of exponential smoothing on Wikipedia, this geometric-decay structure is shared by the whole family of exponential smoothing methods, not just the chart EMA — which is also why the same alpha-driven trade-off between lag and noise shows up whenever exponential smoothing is applied to any time series, not only prices.
Frequently Asked Questions
None of the mechanics above are a trading signal by themselves. An EMA, a crossover rule, or a Wilder-smoothed oscillator all still need testing against real historical data, with a defined entry and exit, before anyone should trust the result on a live chart. That's the gap between reading a formula and having an edge — and it's the gap a proper backtest is built to close. Read the formula, run the numbers, and then test the rule before trusting the line on the chart.
For how the 9/21 pair sits in a full Nifty and Bank Nifty intraday setup, see our best intraday indicators for the Indian stock market.