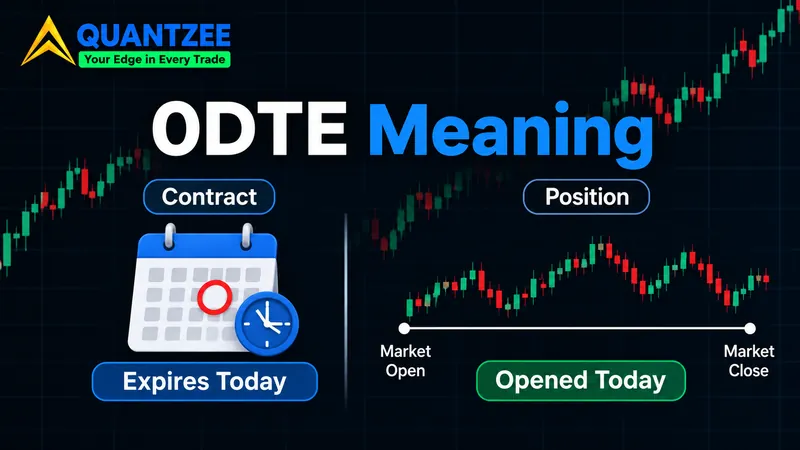
The hole in every 0DTE explainer
Search "0dte options" and you get the same page three times over. OptionAlpha draws a decay curve and calls it a day. SpotGamma spends 8,500 words on dealer hedging flows without once showing a payoff diagram or a cost example. Both treat same-day expiry as a shape to describe rather than a number to compute, without ever naming which products actually carry a same-day expiry across the full week. According to Cboe, 0DTE contracts made up roughly 43 percent of S&P 500 index-option volume in 2023, rising toward the high-40s by 2024 — but that volume share tells you how popular the product is, not what an hour of holding one actually costs.
That gap is the whole reason to write this page. Nobody puts a dollar figure on same-day decay, hour by hour. Nobody compares that number against the one other cost that matters just as much: the bid-ask spread. We built that table ourselves, and the same arithmetic gets worse the moment a second leg enters the position — see the four-fill cost math on a strangle for what crossing that spread twice on each side actually does to a strangle's breakevens. This piece is part of Quantzee's index options documentation set, and it walks through the table first, then covers the mechanics — gamma, settlement, pin risk — that decide what happens when the clock runs out.
A short note on scope before the numbers start. Same-day expiry exists on index products because the exchanges expanded weekly expirations to cover every trading day. SPX added Monday and Wednesday expirations in 2022, on top of the long-standing Friday cycle, so that by the end of that rollout a same-day contract existed for every single session. That is a licensing and listing decision by Cboe, not a trading strategy, and it is worth separating the two: the product existing every day is a market-structure fact, same as the volume-share statistic covered further down this page.
Decay in dollars: an hourly table for one same-day expiry
Qualitative decay curves are easy to draw and easy to misread. A number is harder to argue with. Our data set for this table is a model illustration, not an observed market quote — we priced a hypothetical at-the-money SPX option using a Black-Scholes framework with these inputs stated up front: underlying at 5,800, strike 5,800 (at the money), implied volatility of 15 percent, an annualized riskless rate input of 5 percent, and the standard $100 contract multiplier. Time to expiry runs from the 9:30 am ET open to the 4:00 pm ET close, roughly 6.5 trading hours, the same short window in which gamma exposure estimates built from open interest go stale.
Here is how the extrinsic value — the part of the premium that isn't intrinsic — drains across the day:
- 9:30 am — extrinsic value per contract: $1,480 (6.5 hours remaining)
- 10:30 am — $1,330 (5.5 hours remaining, roughly $150 of decay in the hour)
- 11:30 am — $1,170 (4.5 hours remaining, about $160 gone)
- 12:30 pm — $990 (3.5 hours remaining, around $180 gone)
- 1:30 pm — $790 (2.5 hours remaining, close to $200 gone)
- 2:30 pm — $555 (1.5 hours remaining, about $235 gone)
- 3:30 pm — $265 (0.5 hours remaining, roughly $290 gone in the hour)
- 3:55 pm — $55 (5 minutes remaining)
The shape matters more than any single number. Decay is not linear — it accelerates as the square root of remaining time shrinks, which is exactly why the last 90 minutes bleed more dollars than the first three hours combined. A trader who buys at 9:30 and holds to 1:30 has already lost roughly 47 percent of the extrinsic value they paid for, with half the trading day still left to run.
Two things change this table in practice. A strike that isn't exactly at the money decays differently. Deep out-of-the-money contracts lose less in absolute dollars, but a larger share of a smaller starting premium. A different implied volatility level scales every row up or down, too. Re-run the same framework at 20 percent IV and the 9:30 am figure rises toward $1,970. At 10 percent IV it falls to roughly $990. The mechanics stay the same. Only the dollar scale moves.
Putting two IV scenarios side by side against the base case makes the scaling effect concrete:
- 9:30 am, 10% IV — extrinsic value per contract: roughly $990
- 9:30 am, 15% IV (base case) — $1,480
- 9:30 am, 20% IV — roughly $1,970
- 12:30 pm, 10% IV — roughly $660
- 12:30 pm, 15% IV (base case) — $990
- 12:30 pm, 20% IV — roughly $1,310
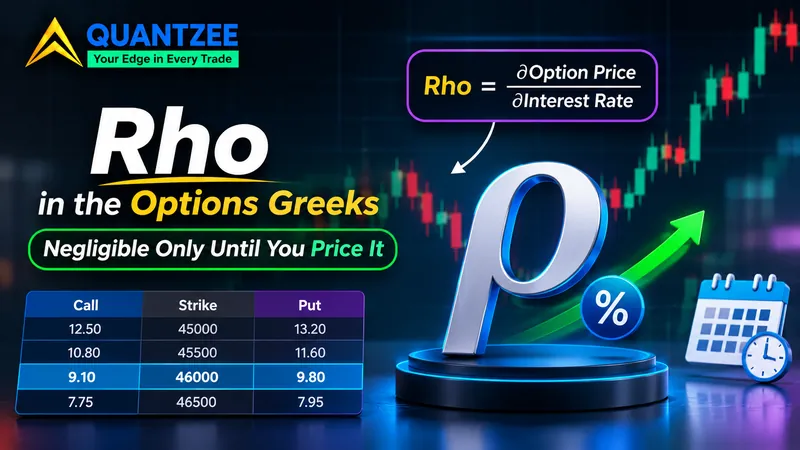
The pattern holds at every hour of the session: doubling implied volatility roughly doubles the extrinsic value on offer at the open, and that ratio compresses only slightly as the day runs down. A trader comparing two different trading days should expect the whole table to shift up or down together when the broad volatility level changes, rather than expecting any single hour to behave differently from the rest, and unlike volatility, rho set against a day of theta stays negligible on contracts this short.
Gamma is the other half of the sentence
Every page that describes decay in isolation is only telling half the story. As extrinsic value drains, the same contract's gamma — its sensitivity to a move in the underlying — rises. That is not a second, unrelated effect; it is the flip side of the same mechanism. A contract that is cheap because little time value remains is, for that exact reason, also the contract whose price moves hardest per point of underlying movement.
Concretely: an at-the-money SPX option with six hours left might have a delta near 0.50 and a gamma that moves that delta by roughly 0.02 per point of underlying. The same option with 30 minutes left can carry a delta that swings by 0.10 or more per point, because there is so little remaining time value to buffer the option's price against the underlying's movement. That is why 0DTE positions are often described as getting "cheaper and more violent" in the same breath — it is one mechanism, priced as it decays, not two separate behaviors stacked on top of each other.
This matters for position sizing more than for entry timing. A contract bought at 10 am and held into the final 30 minutes doesn't just lose extrinsic value — it becomes a materially different risk object than the one originally purchased, even if the underlying hasn't moved at all.
Spread versus decay: the hour crossing the spread costs more than theta
The decay table above assumes a trader can enter and exit at the mid-price. In practice, entering and exiting a 0DTE option means crossing a bid-ask spread twice, and that spread is itself a cost that competes directly with theta decay for which number actually hurts more.
On a liquid SPX 0DTE at-the-money strike during regular hours, spreads of $0.05–$0.15 per contract (multiplied by $100, so $5–$15) are typical when volume is heavy, widening to $0.25–$0.50 ($25–$50) in the first and last 15 minutes of the session when market makers pull back and quotes thin out. Compare that against the hourly decay figures above: at 9:30 am, one hour of decay costs roughly $150 — well above even a wide spread. But by 3:30 pm, with only 30 minutes left and decay already accelerating, a $40 spread on a contract worth $265 is eating 15 percent of the remaining premium in a single round trip, a cost on the same order as the final hour's own decay, and a two-leg position such as a long stock options straddle crosses that spread on both legs.
The practical takeaway: the spread-versus-decay tradeoff flips over the session. Early in the day, decay dominates and spread cost is a rounding error. In the closing 30–60 minutes, the spread can rival or exceed what theta is taking, particularly on strikes further from the money where liquidity is thinner to begin with.
Settlement mechanics stated as rules, not folklore
Index 0DTE products and single-stock or ETF 0DTE products settle differently, and the difference decides what a holder is left with at the close. SPX and other cash-settled, European-style index options cannot be exercised early; they settle in cash based on the index's value at expiration, with no shares changing hands. According to the Options Clearing Corporation's published rules, the final settlement value for standard SPX options is determined at the close on the expiration date.
ETF options — SPY, QQQ, IWM — are physically settled and American-style. They can be exercised any time before expiration. If one finishes in the money at expiration, it results in an automatic exercise that delivers or calls away 100 shares of the underlying ETF per contract. The practical cut-offs differ too. Option holders generally must communicate contrary exercise instructions to their broker by a defined cut-off time after the close, commonly 5:30 pm ET, and a broker's own internal deadline is frequently earlier than that. A short ETF put that finishes even one cent in the money at 4:00 pm can result in 100 shares landing in an account overnight. That is a position the account holder did not explicitly request and may not have the buying power or desire to carry.
Pin risk and the near-the-money close
Pin risk is the specific case where a contract finishes close enough to the strike that nobody — not the holder, not the writer — can be certain which side of in-the-money it will land on until the final print. It is the one scenario in 0DTE trading where "I know what I own" stops being true in the last few minutes of the session.
For a cash-settled index option this is an accounting problem: the payout is simply whatever the settlement value turns out to be. For a physically settled ETF option, pin risk is a logistics problem — a short option writer who assumed they'd expire worthless can wake up to an assigned stock position, with its own margin requirement, gap risk, and tax treatment, the same cash-settled versus deliverable options split that decides which outcome applies. Traders managing 0DTE ETF positions into the final minutes generally close out any contract within a few cents of the strike rather than let automatic exercise rules decide the outcome for them.
0DTE volume share is a market-structure fact, not an edge
The statistic that gets repeated most often is that 0DTE contracts represent roughly four or five of every ten S&P 500 option contracts traded. That figure is accurate per Cboe's own published data. It is also, on its own, meaningless for a retail trader's decision to use the product. A contract type can dominate exchange volume and still be a net losing instrument for the people trading it. The two claims are entirely separate, and the explainers that blend them together are doing their readers a disservice.
What the volume figures do tell you: liquidity is deep on the major index strikes during regular hours, spreads are tight on the most active names, and institutional flow — dealer hedging, 0DTE-specific option strategies, large directional and volatility trades — is a real share of that volume. What the figures do not tell you: nothing about win rates, nothing about expectancy, and nothing about whether any particular 0DTE structure is profitable over time. Reports that cite the volume-share number as evidence that 0DTE trading "works" are reporting a market-structure fact as if it were a performance claim.
The honest limits of trading something that expires today
Same-day expiry compresses every decision most options strategies spread across days or weeks into a handful of hours. There is no overnight to think it over and no following session to recover a bad entry — the position is either right by the close or it is closed out, assigned, or expired. That compression is the entire character of the instrument, for better and worse, and it is also why this page has stayed in mechanics rather than strategy: no win rate, expectancy figure, or backtested performance number appears here, because none would survive the honest caveat that a single day's sample proves nothing about the next one.
This article is analytical software documentation, not advice, and nothing above should be read as a recommendation to trade 0DTE contracts in any particular way. Anyone studying this mechanic for the first time should paper trade it before risking real capital, specifically to get a feel for how fast the gamma and spread dynamics above actually move once the clock is running.
Margin and buying power: what carries into the close
A long 0DTE option is simple from a margin standpoint. The premium paid is the maximum loss, and no additional buying power gets tied up as the day progresses. A short 0DTE option is a different animal. Most brokers calculate margin on a short option using a percentage-of-underlying formula plus the option premium, and that margin requirement moves with the underlying throughout the session — a short strangle that looked comfortably collateralized at 9:30 am can require meaningfully more buying power by 2 pm if the underlying has moved toward either strike.
This is where the hourly decay table and the margin question intersect. The extrinsic value a short seller collects shrinks every hour, which is the point of selling premium. But the margin a broker holds against that short position does not shrink at the same rate — it tracks the underlying's distance from the strike, not the option's remaining time value. A trader evaluating a short 0DTE position needs both numbers, not just the premium collected, because a position that is "working" on a mark-to-market basis can still be consuming more buying power than it was at the open.
Pattern day trading rules add a second constraint specific to US accounts under $25,000 in equity: a 0DTE position opened and closed within the same session counts as a day trade, and four or more within five business days in a margin account under that equity threshold triggers a pattern day trader flag, which locks the account to a higher minimum equity requirement going forward. Traders working through small accounts need to track this separately from the P&L of any individual 0DTE trade.
What a full round trip actually costs, stacked together
Put the pieces above on one page and a full round trip — buy, hold, and sell the same contract within the session — carries three distinct costs that rarely get added up in one place. First, the decay cost, which the hourly table above prices directly and which depends entirely on how long the position is held. Second, the spread cost, paid twice, once on entry and once on exit, and which widens specifically in the opening and closing minutes when the decay table also shows the steepest hourly losses. Third, for a short position, the margin carrying cost in the sense of buying power consumed and unavailable for other trades, even though no interest is charged on it directly.
None of these three costs is unique to 0DTE contracts on its own. A multi-day option position also decays, also crosses a spread, and also consumes margin if sold short. What is specific to 0DTE is the compression: all three costs land inside a single session instead of being spread across days, so a trader who is sloppy about entry and exit timing on a 0DTE contract pays for that sloppiness within hours rather than having days to average into a better fill.
Where this fits with the rest of an options toolkit
If the hourly table above is the first time you've seen decay priced in dollars rather than described as a curve, the index options indicators guide is the next logical read — it walks through the broader signal set traders watch around index options, 0DTE or otherwise. For the Greeks referenced throughout this piece, the options Greeks glossary entry covers delta, gamma, theta, and vega in more depth than fits here. The implied volatility inputs used in the decay table are explained further in the implied volatility glossary entry, and the broader relationship between volatility levels and index option pricing is covered in the volatility index options trading guide. The spread-crossing cost discussed above is one specific instance of a cost category covered more generally in the slippage glossary entry.
For the regulatory side of settlement and exercise rules, the U.S. Securities and Exchange Commission (sec.gov) and FINRA (finra.org) both publish investor-education material on options exercise and assignment that goes beyond what any brokerage glossary covers. Cboe's own site (cboe.com) is the primary source for the volume-share figures cited above, and Interactive Brokers' glossary (0DTE options glossary entry) has a clean definition if you want a second framing of the exercise-style distinction.
For the chart side of a same-day trade, the indicator stack and the one-day expected-move calculation are in the best TradingView indicators for options traders.