A stock options straddle is one call and one put on the same underlying, at the same strike and the same expiry, both bought. You pay a net debit, that debit is your maximum loss, and you profit if the stock moves far enough in either direction. Every explainer stops there, at two breakeven prices. The better question is what those two prices are telling you: the debit is the market's own quote for how far the stock will travel, and you can hold that quote up against how far the stock has actually been travelling. That comparison is what this post is about.
Last updated: 10 November 2026. Everything below is an illustrative calculation unless a figure is attributed to a named source. We built the arithmetic ourselves and none of the premiums are live quotes.
The straddle structure in one paragraph
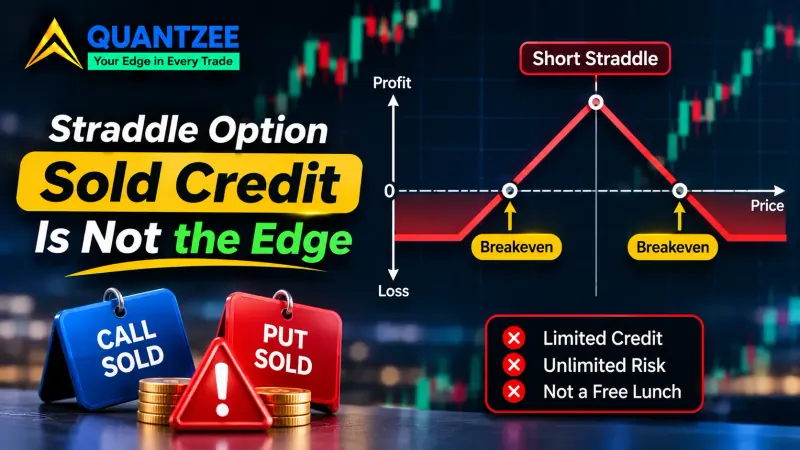
Same underlying, same strike, same expiry. One call, one put, both bought, paid as a single net debit. That debit is the most you can lose, and you lose all of it if the stock finishes exactly at the strike on expiry day. The long straddle is the version most people mean when they search the term. The short straddle, where you sell both options for a credit, is the mirror image with unlimited risk on the upside and large risk on the downside, and it belongs in a different conversation about risk.
According to the Options Industry Council, a long straddle is a volatility position: you want the underlying to move, and you care less about which way. The OIC's long straddle page lays out the same payoff shape. The SEC's investor education site carries a short plain-language entry too, in the investor.gov glossary.
If you want the contrast with its wider cousin before going further, our straddle vs strangle glossary entry covers the definitions side by side. This post assumes you know the shape and wants to get to the money question.
Straddle breakeven: do the arithmetic once, then reverse it
Two formulas carry the whole topic.
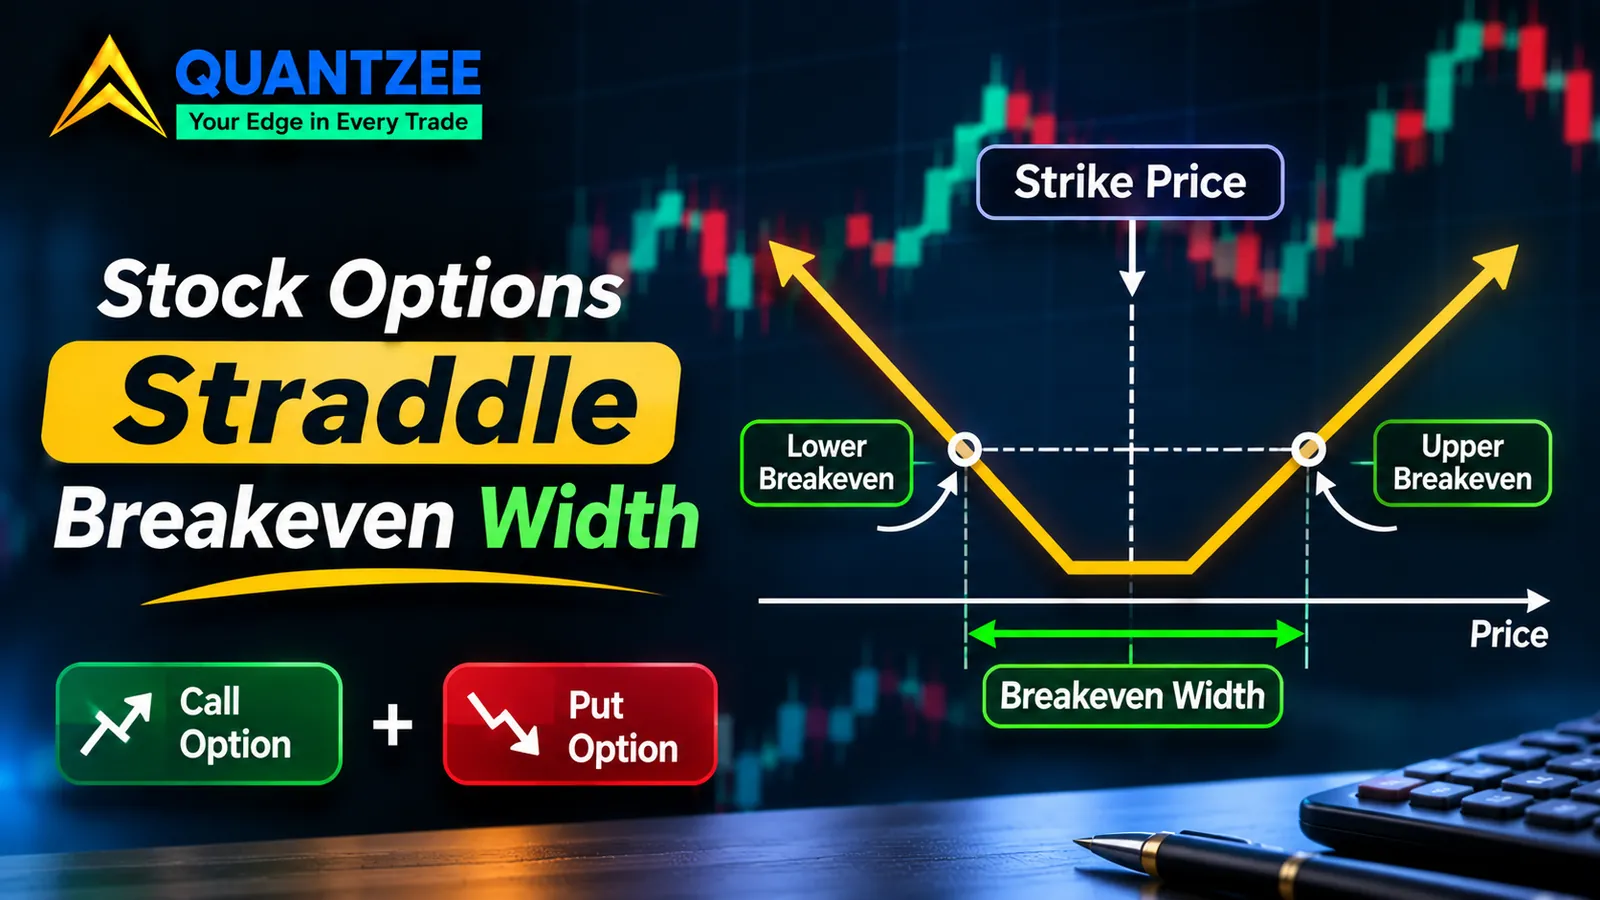
- Upper breakeven = strike + total debit
- Lower breakeven = strike − total debit
Take an illustrative stock trading at $100. You buy the 30-day $100 call for $3.10 and the 30-day $100 put for $2.90. The total debit is $6.00 per share, or $600 for one contract of 100 shares. Upper breakeven is $106. Lower breakeven is $94. Your maximum loss is $600, and it is a realistic outcome, not a tail.
That is where most pages end. Now reverse it. The distance between the two breakevens is 2 × the debit, so $12.00 here. As a share of the $100 spot price, each side sits 6% away. The straddle is telling you that the market charges $6.00 for a move of 6% in either direction by expiry. If the stock ends a hair inside $94 to $106, you lose money even though it moved. Outside that band you gain, dollar for dollar, whatever the stock travels beyond it.
Read that way, the breakeven is no longer just a line on a payoff diagram. It is a price tag on movement, quoted as a percentage of spot. A straddle at $6.00 on a $100 stock and a straddle at $6.00 on a $200 stock are not the same product at all; the second one is half as expensive, 3% each way. Always divide by spot before you compare anything.
The priced move: turning the debit into a per-day number
A 6% priced move over 30 calendar days sounds abstract. Convert it. Thirty calendar days contain roughly 21 trading sessions. Price moves do not scale linearly with time; they scale with the square root of time, which is why a naive "6% divided by 21" gives the wrong answer.
A workable rule of thumb for an at-the-money straddle: the debit is close to 0.8 × the implied standard deviation of the stock over the life of the option, times spot. Put differently, debit as a percentage of spot ≈ 0.8 × daily volatility × √(days). With our numbers:
- Debit as a percentage of spot: 6.0%
- Sessions to expiry: 21, and √21 ≈ 4.58
- Implied daily standard deviation ≈ 6.0% ÷ (0.8 × 4.58) ≈ 1.64% per session
- Implied average absolute daily move ≈ 0.8 × 1.64% ≈ 1.31% per session
So the options market, by pricing this straddle at $6.00, is saying: expect the stock to wander about 1.3% a day on average, measured without regard to sign. That is a testable claim, because you can look at what the stock has been doing.
The rule of thumb is an approximation. It ignores skew, interest rates and the way real chains are quoted, and the 0.8 factor assumes a roughly normal distribution of returns. For a first read it does the job, and our implied volatility glossary entry explains the standard-deviation language behind it.
Comparing the quote with what the stock actually did
Here is the check that decides whether you are paying up. Pick a named instrument, pick a lookback, and say how you measured it. The cleanest simple measure: take the average absolute close-to-close change over the same number of sessions as your option has left. For a 21-session option, look at the last 21 sessions, then repeat for the last 63 so you can see whether the recent window is calm or unusual.
Continue the illustration. Suppose the stock's average absolute close-to-close change over the last 21 sessions was 0.9%, and over the last 63 sessions was 1.0%. Both numbers are illustrative.
- Priced: about 1.31% per session, from the straddle
- Delivered over 21 sessions: 0.9% per session
- Delivered over 63 sessions: 1.0% per session
Turn the delivered figure back into a breakeven-sized quantity. An average absolute move of 1.0% a day implies a daily standard deviation near 1.25% (divide by 0.8). Over 21 sessions, 1.25% × 4.58 ≈ 5.7% for one standard deviation, and 0.8 × 5.7% ≈ 4.6% for the expected absolute move. The straddle charges 6.0% for a move the stock's recent habit would deliver at about 4.6%. On that reading, the buyer is paying roughly 30% more than recent behaviour suggests, and needs the stock to speed up to break even.
Flip the numbers and the logic flips. If the recent window had delivered 1.6% a day, the same $6.00 straddle would look cheap against realised movement, and the buyer would have the stronger case. Neither outcome tells you the future. It tells you what you are being asked to believe.
Two cautions about this comparison. First, a calm stretch can be followed by a violent one, and a lookback that missed a recent shock will undersell the risk. Second, if a known event sits inside the option's life, such as an earnings release, the priced move is supposed to be higher than the quiet-day average, because one or two sessions carry most of the variance. In that case compare the straddle with the stock's past reactions to that event rather than with its ordinary days.
Why an at-the-money straddle is close to pure volatility exposure
At the strike, the call has a delta near +0.50 and the put a delta near −0.50. They roughly cancel, so the position starts close to direction-neutral. A $1 nudge in the stock barely changes your value at the moment you enter. What you own instead is exposure to movement itself and to the level of implied volatility.
That gives the position two ways to earn and two ways to disappoint. It earns if the stock moves a lot, and it earns if implied volatility rises after you buy. It disappoints if the stock sits still, and it disappoints if implied volatility falls. Notice that the two exposures are separate. You can be right about the move and still lose on the volatility leg. The options Greeks glossary entry defines delta, gamma, theta and vega if you want the signs in one place.
What goes wrong when you are right about direction
Two failure modes catch buyers who made a sound directional call.
The move arrives too slowly
Time decay is the cost of holding. In our illustration the straddle costs $6.00 on day one. If the stock drifts from $100 to $103 across three weeks, a clear move up, the position can still be worth less than what you paid, because the decay bled the time value out faster than the gain on the call built up. The stock needed to reach $106 by expiry, or to get there fast enough that the option kept its value on the way. Arriving late is the same as not arriving.
The move arrives but implied volatility collapses
This is the earnings case. Before a scheduled announcement, implied volatility inflates because the market knows a large move is possible. After the news, that uncertainty disappears and implied volatility drops hard, often within a single session. A stock can jump 4% and your straddle can still lose money, because the volatility component of both options deflated at the same moment the stock moved. The straddle you bought was already priced for a big move; a big move is the break-even condition, not the profit.
The practical lesson is that "the stock moved" and "the straddle made money" are different statements, and the gap between them is exactly the priced move from the previous section.
Gamma against theta as expiry approaches
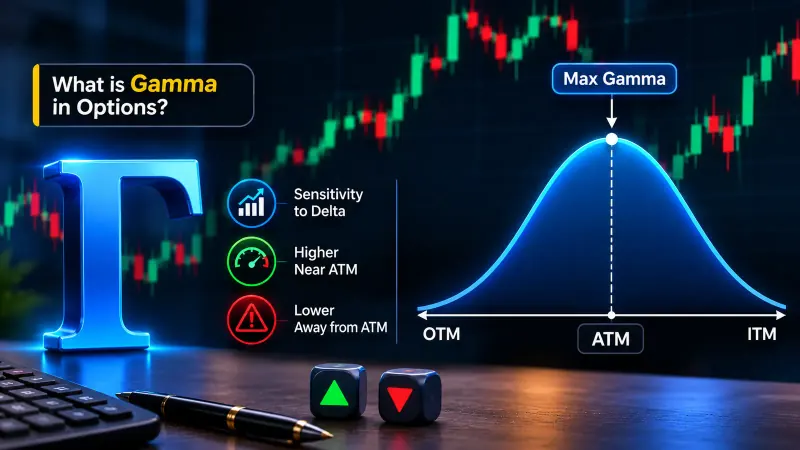
A long straddle owns gamma, which means its delta changes in your favour as the stock moves. If the stock rises, the call delta grows toward +1 while the put delta shrinks toward 0, so your position becomes increasingly long the stock. If the stock falls, the reverse happens. That convexity is what the premium buys, and how gamma rewrites delta over several moves shows how fast it compounds.
The bill for gamma is theta. Both options lose time value every day, and the loss is not even. It tends to accelerate as expiry nears, especially for options sitting right at the strike, where gamma is also at its highest. Near expiry you hold the most convexity and pay the fastest rent for it at the same time.
This is why the holding period is a decision, not an afterthought. A reader who buys 30 days out and plans to hold to the end is making a different bet from one who buys 45 days out and plans to sell in 15, even on the same underlying. The second buyer pays more premium but sheds less of it per day and does not have to survive the steepest part of the decay curve. Our theta decay glossary entry shows the shape of that curve, and it is worth reading before you choose an expiry.
A habit worth building: before entry, write down the date by which you expect the move to have shown up. If that date passes without it, the thesis has failed on timing, regardless of what the chart looks like.
When a strangle is the better expression of the same view
If you believe a big move is coming but the straddle debit makes the priced move look steep, a long strangle is the usual alternative. You buy an out-of-the-money call and an out-of-the-money put instead of two at-the-money options. Using the same illustration, a $105 call at $1.60 and a $95 put at $1.50 cost $3.10 in total, about half the straddle.
The trade-off is plain. The cheaper debit buys wider breakevens: $108.10 and $91.90, which are 8.1% from spot against the straddle's 6%. You risk less money to enter and need more movement to win. Both numbers are illustrative.
When the move you expect is large and you are confident about its size, the strangle's lower cost can be worth the extra distance. When you expect a modest move that is still larger than the market is charging for, the straddle's nearer breakevens give you more room to be right. Neither is better in general. The decision turns on the same comparison as before: what move is priced, and what move do you think is coming? The straddle vs strangle glossary entry has the side-by-side definitions.
Sizing: the debit is the position size
Most pages skip this. In a long straddle, the maximum loss is the entire debit, and the chance of finishing inside the breakeven band is not small. Given the numbers we built above, the band covers a move of less than 6% in either direction, which for a stock with a typical daily move around 1% is a very ordinary outcome. A $600 debit on one contract is not a $600 "risk" in the sense that it might hit some day; it is a position that routinely loses a large share of itself.
So treat the debit as the size of the bet. If you would not be comfortable losing the full $600, the position is too large, however attractive the setup looks. Several straddles on different stocks in the same sector are not diversification if the same macro event moves them all together. FINRA's investor pages discuss options risk in plain terms, and its overview of options is a useful read before any multi-leg trade.
What we do not claim
We are not giving you a win rate for straddles, long or short. We have none, and we compared the pages that rank for this keyword to see whether anyone else does. They do not. One options-software vendor's strategy page has a statistics panel that is an empty placeholder block, with no sample, no date range and no result in it. Another vendor's page shows two worked examples on a named ticker and no performance data at all.
The worked example above is built from round, illustrative premiums. It is not a quote read off a live chain at a timestamp, and it should not be read as one. If you apply the method, use the real bid and ask from your own broker's chain, note the time, and run the comparison on the actual figures. Quantzee builds analytical software for traders. This article is education about how a structure is priced, not a recommendation to buy any option.
A short routine before you pay a premium
Here is the sequence in order, since it is easy to do half of it and stop.
- Read the call and put premiums off a live chain and add them to get the debit.
- Compute both breakevens and the width, then divide the debit by spot to get the priced move as a percentage.
- Count the sessions to expiry and convert the priced move into an implied average daily move.
- Measure the stock's own average absolute close-to-close change over the same number of sessions, and over a longer window as a sanity check.
- Check the calendar for events inside the window, and decide whether the comparison should use the stock's past reactions to them.
- Write down the date by which the move should have appeared and the debit you accept losing in full.
If you track index options as well, our index options indicators guide covers the indicator side of that workflow. None of it replaces the arithmetic above; it just helps you decide where to look.
Sources behind the mechanics: Fidelity's education piece on straddling the market works through a $40 strike example with a $375 cost and breakevens at $43.75 and $36.25, and tastytrade's straddle page works a $540 strike at 45 days to expiry with breakevens at $556.50 and $523.50. Both are good for the payoff shape. Neither compares the premium to the stock's realised movement, which is the gap this post tries to close.