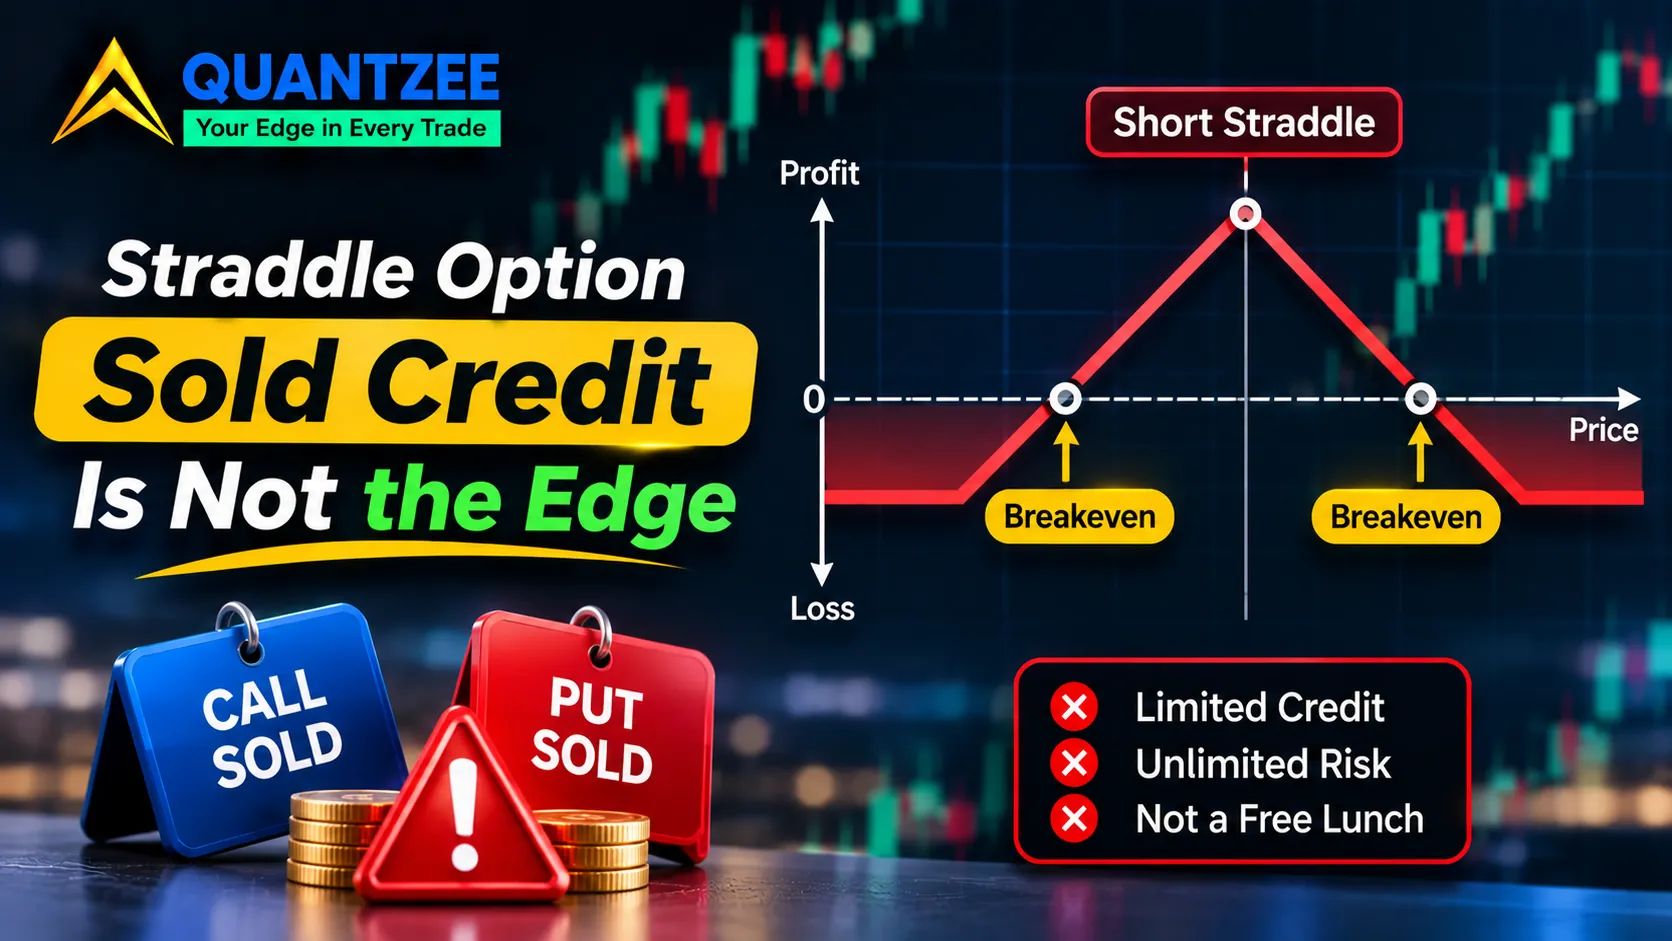
A straddle option sold on the short side pays you a credit up front, and that credit is the only part of the trade anyone remembers. You sell one call and one put on the same underlying, at the same strike and the same expiry, and cash lands in your account. The credit is also the most you can ever make. What you took on in exchange is a loss profile with no ceiling on one side and a very deep floor on the other. This post is about the gap between those two facts, and about how to put a number on it before you click the sell button.
Last updated: 10 November 2026. Every dollar figure below is an illustrative calculation that we built ourselves, not a live quote and not a past result. Where a number comes from a named source, we say so.
What a short straddle is, and what the credit really is
Take the plain version. You sell a call and a put at the same strike, both expiring on the same date, and you collect a net credit. Maximum profit is that credit, and you only keep all of it if the underlying finishes exactly at the strike on expiry day. Anywhere else, some of it goes back. According to the Options Industry Council, a short straddle is a position that profits from a stock that stays put and loses from a stock that moves, with risk that is large in both directions. The OIC short straddle page sets out the payoff shape, and Option Alpha's short straddle guide walks through the same structure with adjustments and rolling.
Here is the reframe that matters. The credit is not income. It is a premium paid to you by someone who wants protection against a big move, and you accepted the job of providing it. The market set the price using its own estimate of how far the stock will travel. Your edge, if you have one, exists only where that estimate is too high compared with what the stock then does. The credit alone tells you nothing about whether that is the case.
If you want the side-by-side definition of a straddle and its wider cousin first, our straddle vs strangle glossary entry covers it. The rest of this post assumes you know the shape and want the risk arithmetic.
Breakevens as a distance, not a price
The two breakeven formulas are short.
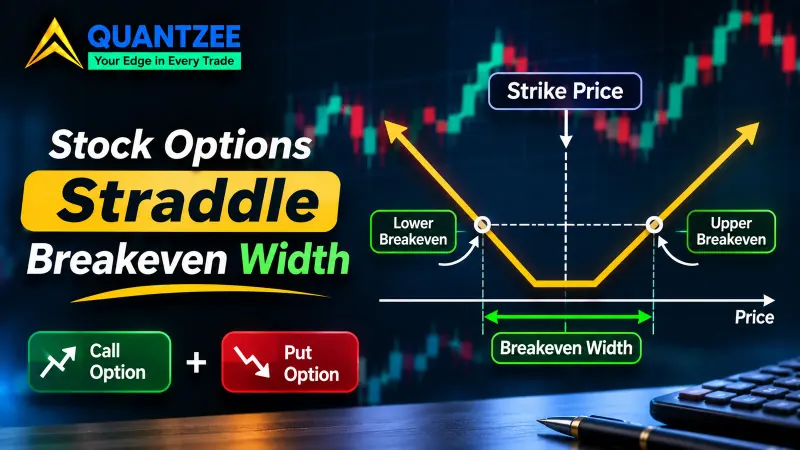
- Upper breakeven = strike + credit
- Lower breakeven = strike − credit
Build an example. A stock trades at $100. You sell the 30-day $100 call for $3.40 and the 30-day $100 put for $3.20. The credit is $6.60 per share, or $660 for one contract of 100 shares. Upper breakeven is $106.60. Lower breakeven is $93.40. Inside that band you profit, at least at expiry. Outside it you lose, dollar for dollar.
Prices are the wrong unit for this. A $6.60 credit on a $100 stock means each breakeven sits 6.6% away from spot. The same $6.60 on a $400 stock is 1.65% away, which is an entirely different bet. So divide by spot first, every time, before you compare one straddle with another.
Now turn the distance into something you can feel. Say the stock has averaged a close-to-close move of 1.2% a day over the last 60 sessions. That is $1.20 on a $100 price. The credit of $6.60 equals 5.5 of those average days (6.60 ÷ 1.20), if every one of them pushed the stock in the same direction. That sounds like a healthy cushion until you look at how stocks actually move: in streaks, in gaps, around news. Five and a half ordinary days of one-way travel across 30 calendar days is not rare.
A second lens uses volatility. Suppose daily volatility, meaning the standard deviation of daily returns, is 1.5%. Over the 21 trading sessions in the 30 calendar days, the one-standard-deviation move is about 1.5% × √21 ≈ 6.9%. The breakevens sit at 6.6%, which is roughly 0.96 standard deviations from spot. If you model returns as a bell curve, which real returns are not, the chance of finishing outside the band is about 34%. We are not offering that as a forecast. We are showing that when the credit is priced fairly, you finish outside your breakevens about a third of the time, and the losses on those occasions are not capped at the size of the wins.
Short gamma: why the same move hurts more near expiry
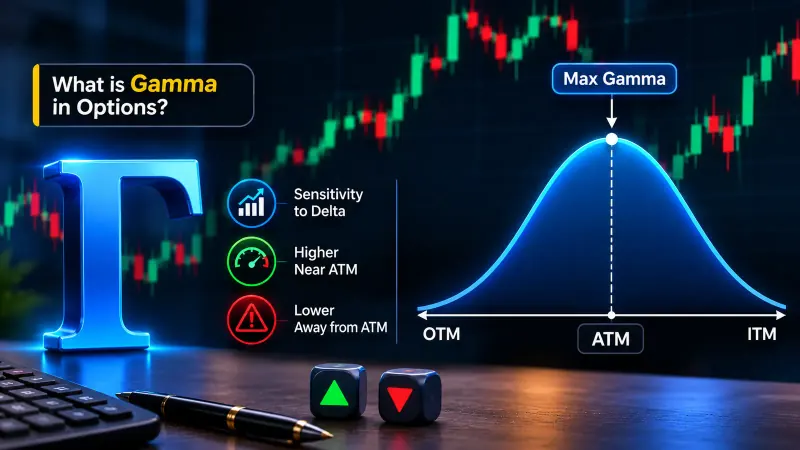
Gamma measures how fast an option's delta changes as the underlying moves. Selling a straddle makes you short gamma on both legs. In plain words: as the price moves against you, your position leans further against you, and that lean gets steeper as expiry approaches. Our options Greeks glossary entry defines each Greek if you want the vocabulary before the maths.
For an at-the-money option, gamma scales roughly with 1 ÷ √T, where T is time to expiry. Time shrinks, gamma climbs. We built the numbers from the standard Black-Scholes at-the-money gamma on the example above, assuming 24% annualised volatility and ignoring rates and dividends.
- With 30 days left, the straddle's gamma is about 0.116 per share. A $3 move against you costs roughly 0.5 × 0.116 × 3² ≈ $0.52 per share from the gamma term alone, or $52 a contract.
- With 5 days left, gamma is about 0.284. The same $3 move costs about 0.5 × 0.284 × 3² ≈ $1.28 per share, or $128 a contract.
That is a ratio of about 2.45, which is √6, since 30 days is six times 5 days. The same $3 move, the same stock, 2.5 times the damage. In the first week the position forgives you. In the last week it does not.
Time decay is the part that makes sellers feel safe. Theta works in your favour every day, and our theta decay glossary entry explains why that decay speeds up toward expiry. The trap is that gamma speeds up at the same moment. The thing paying you and the thing hurting you both accelerate on the same calendar. Sellers tend to remember the first and discover the second late.
Dealers who take the other side of customer flow face the same maths in reverse, and their hedging can add to price moves. SpotGamma's gamma exposure explainer describes how that works, and it is upfront that the sign of dealer positioning is a modelling assumption rather than something observed directly. We cite it for the mechanism and keep its caveat attached.
Negative vega: a loss without a price move
A short straddle is also short vega. When implied volatility rises, both options you sold become more valuable, and your position is marked down even if the stock has not moved by a cent. Our implied volatility glossary entry covers what that number represents.
The size is easy to estimate. For an at-the-money option, vega is roughly spot × 0.3989 × √T. On the example, with T at 30/365, that is $100 × 0.3989 × 0.2867 ≈ $11.44 per full 1.00 change in volatility, or about $0.114 per volatility point per option. Two legs give about $0.229 per point. If implied volatility jumps 5 points, that is $1.14 per share against you, or $114 a contract. Against a $6.60 credit, that is 17% of your maximum profit gone before the stock has moved at all.
This is why experienced sellers look at where implied volatility sits inside its own recent range before they sell. Selling when it is near the bottom of that range means you collect a small credit for the same open-ended risk, and you have more room to be hurt by a rise. Selling when it is elevated pays better, but elevated levels usually have a reason, such as earnings or a scheduled event, and that reason is the move you are insuring.
The loss profile, in dollars
The call side has no ceiling. If the stock rallies to $150, the call you sold is worth at least $50, and your total loss on the position is $50 minus the $6.60 credit, so $43.40 per share, or $4,340 a contract. At $200 it is $9,340. There is no cap other than the stock's own limits.
The put side is bounded, but only by zero. If the stock falls to nothing, the loss is the $100 strike minus the $6.60 credit: $93.40 per share, or $9,340 a contract. Calling that a "defined" loss is technically correct and practically useless.
So the credit is never the risk budget. A $660 credit does not mean you are risking $660. It means you are risking whatever the market decides to do to a position that can lose many multiples of the credit. Size it as if the loss you could take is several times the credit, because it is.
Early assignment and dividends on single-stock options
Most pages on this topic never mention it, and it is a real mechanic. American-style options on single stocks can be exercised at any time before expiry. The short call is the one at risk around dividends. If a stock is about to go ex-dividend and the call you sold is in the money with little time value left, the holder may exercise it early to capture the dividend. You wake up short 100 shares per contract, and the put you sold is still open. Your tidy two-leg position is now a short stock position plus a short put.
The put side can be assigned early too, usually when it is deep in the money. Index options settled in cash avoid this, but single-stock straddles do not. The rule that follows is simple: check the dividend calendar before you sell a single-stock straddle that crosses an ex-dividend date, and know your broker's process for handling assignment. The investor education pages from the SEC's investor.gov glossary define the term, and your options disclosure document explains exercise rules.
Margin: the requirement moves with the market
A short straddle is not a defined-risk position, so your broker sizes the margin requirement from the position's exposure, and that figure changes as the stock and implied volatility change. When the market moves against you, the requirement can rise at the same time your account value falls. That is the setup for a forced exit at the worst price.
We are not going to quote a margin number. The formula is broker-specific, and some firms apply house rules stricter than the exchange minimum. Check your own broker's figure for the exact position before you enter, then check it again after a large move. FINRA's options overview for investors is a reasonable place to start on what the rules cover.
The defined-risk cousins, and what you give up
If the open-ended tail is the problem, there are two ways to reshape it.
A short strangle sells an out-of-the-money call and an out-of-the-money put instead of two at-the-money options. The credit is smaller, the breakevens are wider, and the tail risk is still uncapped. We cover that structure in our post on short strangle options.
An iron condor goes further and buys a wing on each side to cap the loss. You pay for that protection out of the credit. On the $100 example, you could sell the $100 straddle and buy a $110 call and a $90 put as wings. The credit shrinks, and in return the worst case is bounded by the $10 wing width minus what you collected. Our iron condor glossary entry has the full structure. A short straddle versus an iron condor comes down to one trade: do you want the larger credit and the unbounded tail, or the smaller credit and a loss you can name in advance? Neither is free. You are choosing which cost to pay.
What we looked for, and what nobody has published
Methodology matters here, so here is how we scored the field. We compared the pages that rank for this keyword and read the dedicated strategy pages end to end. Two of them are real content competitors. One strategy page carries a statistics section, with headers for win rate and average credit, that renders as "No items found". It has no sample size, no date range and no outcome figures behind it. The other works a short straddle at an $89 strike for a $5.80 credit, with breakevens at $94.80 and $83.20, and then lists pros and cons without any outcome data. We found no measured short-straddle result anywhere on page one.
So we are not going to invent one. We have no win rate to give you, no average credit and no expectancy figure, and anyone who hands you those without a method is guessing. A usable figure would need all of the following stated up front:
- the instrument and the date range
- the strike selection rule
- the entry filter, such as implied volatility rank
- the management rule for adjustments
- the exit rule, including the loss stop
- trading costs and slippage on both legs
Leave one of those out and the number cannot be reproduced. That is the standard we hold our own work to at Quantzee, which is analytical software and not advice. If you test short straddles yourself, write all six items down before you run the test, not after you see the result.
A routine before you sell one
- Read the call and put bids off a live chain and add them to get the credit. Use the bid, not the mid, since that is what you can realistically sell at.
- Compute both breakevens and divide the credit by spot to get the priced move as a percentage.
- Count sessions to expiry, then compare the priced move with the stock's own realised daily range over a matching window and a longer one.
- Check implied volatility against its recent range, and check the calendar for earnings, dividends and any scheduled event inside the window.
- Look up the margin requirement for the exact position at your broker, and the loss you would take at a move of two and three times the credit.
- Decide the loss at which you exit and the date by which you close, before you place the order.
None of that predicts anything. It makes the exposure visible, which is the part most explainers skip. The glossary pages linked above cover each Greek and the structures that sit near this one.