A short strangle is one short out-of-the-money call plus one short out-of-the-money put. Same underlying, same expiry, different strikes. This page explains that structure the way every other page on the first search results screen does, with worked payoff numbers and a diagram. Then it does something none of them do. It reports a real measurement of a short strangle sold against a live signal, including the loss, the sample size and the reasons the loss happened. This is a structure explainer plus a reported result. It is not a recommendation to trade short strangle options, and nothing below should be read as one.
What a Short Strangle Actually Is
You sell one call above the current price and one put below it. Both expire on the same date. Both legs are out-of-the-money when you open the trade, which means neither strike has intrinsic value yet. You collect two premiums up front — the credit for the call plus the credit for the put — and that combined credit is your maximum possible profit. The position profits if the underlying stays between the two strikes through expiry, because both options then expire worthless and you keep the full credit.
Compare that with a short straddle, where both legs sell at the SAME strike instead of two different ones. A straddle collects more premium per contract because both options sit closer to the money. But the profit zone around that single strike is narrower. The straddle-vs-strangle breakdown on Quantzee's glossary covers that trade-off in full if you are deciding between the two.
The Payoff Math, Worked on Round Numbers
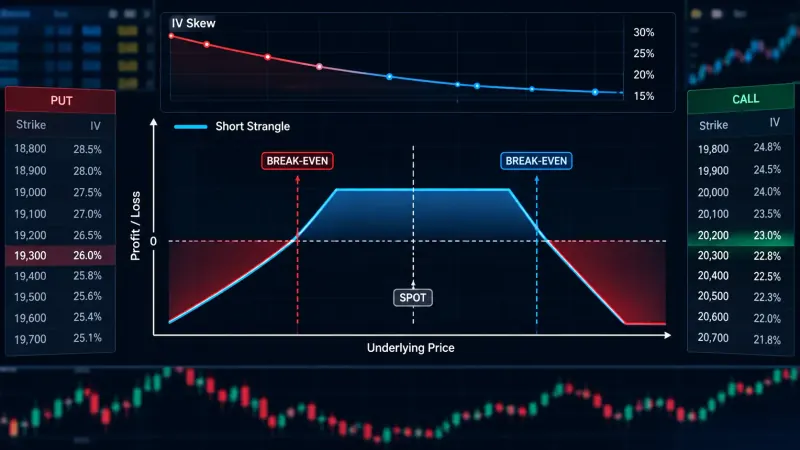
Here is the arithmetic on a clean example so the mechanics are checkable by hand. Take an underlying trading at $100. Sell the $105 call for $2.50 and sell the $95 put for $2.50, for a total credit of $5.00. Your breakevens sit at $90 (put strike minus total credit) and $110 (call strike plus total credit), evenly spaced here, though on real index chains volatility skew pulls delta-matched break-evens apart. Between $95 and $105, both legs expire worthless and you keep the full $5.00. Outside that range but inside the breakevens, you keep part of the credit. Outside the breakevens, you are losing money. That loss has no ceiling on the upside side of the trade.
A full profit-and-loss table at seven settlement prices makes the shape explicit:
| Settlement price | Call leg P&L | Put leg P&L | Total P&L |
|---|---|---|---|
| $70 | +$2.50 | -$22.50 | -$20.00 |
| $90 | +$2.50 | -$2.50 | $0.00 |
| $95 | +$2.50 | +$2.50 | +$5.00 |
| $100 | +$2.50 | +$2.50 | +$5.00 |
| $105 | +$2.50 | +$2.50 | +$5.00 |
| $110 | -$2.50 | +$2.50 | $0.00 |
| $130 | -$22.50 | +$2.50 | -$20.00 |
Read the $70 and $130 rows side by side. At $70, the put leg alone loses $22.50 before the call's $2.50 credit offsets any of it, for a net $20.00 loss. At $130, the call leg alone loses $22.50 the same way. Each $1 the underlying moves past a breakeven costs $1 on that leg. There is no floor on how far the call side can go, and a floor only at zero on the put side. That asymmetry — a defined maximum profit against an open-ended maximum loss on one side — is the single fact every short strangle trader has to carry into the position. It is visible in the table above as arithmetic, not as a warning label.
The Payoff Diagram
Picture a flat line at +$5.00 running between the two breakevens at $90 and $110. Left of $90, the line angles down at a 1:1 slope with no floor. Right of $110, it angles down at the same 1:1 slope with no ceiling. The flat top is your entire profit potential. Both sloped ends are open. A trader reading a payoff diagram for the first time usually focuses on the flat top. The two open ends are the part that matters more for sizing a position, because that is where the structure's real risk lives.
What Decay and a Rise in Implied Volatility Each Do to the Position
Two forces move a short strangle's value every day it is open, and they do not move it the same way. Time decay works in the seller's favor. Every day that passes with the underlying inside the breakevens, both options lose a little extrinsic value, and that erosion accelerates as expiry approaches. A rise in implied volatility works against the seller. It inflates the extrinsic value of both legs regardless of where the underlying sits, which is why a strangle sold the day before an earnings report or an economic release carries a different risk profile than one sold on a quiet week. According to the Options Industry Council's investor education material, a short option's extrinsic value is driven jointly by time to expiry and implied volatility. A seller profits only when the combined decay outpaces any adverse move in the other direction. Decay and volatility pull in opposite directions on the same position. A short strangle only works out when decay wins that pull by expiry.
Short Strangle vs Short Straddle vs Iron Condor
These three structures sell the same basic idea — collect premium from a range-bound view — with three different risk shapes. The table below states what each one does on credit size, breakeven width and whether the risk is capped, with no preference stated for any of the three.
| Structure | Legs | Relative credit | Breakeven width | Risk bounded? |
|---|---|---|---|---|
| Short straddle | 2 (same strike) | Highest | Narrowest | No |
| Short strangle | 2 (different strikes) | Medium | Wider than straddle | No |
| Iron condor | 4 (strangle plus two long wings) | Lowest | Widest | Yes, both sides |
An iron condor buys a further out-of-the-money call and put against each short leg. That caps the loss on both sides at a known maximum — the width between the short and long strike on each side, minus the net credit collected. That bounded risk costs something. The long wings eat part of the credit, so an iron condor collects less than the strangle it is built around. Whether that trade-off is worth making is not a structural question with one right answer. It depends on what the underlying signal actually does, which is what the next sections measure rather than assume.
How Strike Distance Changes the Trade-Off
Moving the short strikes further from the current price changes two things at once, and they pull against each other. A strike that sits further out-of-the-money carries less premium, because it has a smaller chance of ever being touched. That smaller premium means a smaller maximum profit and narrower breakevens on paper, but it also means the underlying has to travel further before the position starts to lose. A strike placed closer to the current price does the opposite. It pays more credit up front, and it gets touched more often, because the underlying does not need to move as far to reach it. Neither distance is automatically the right one. The correct distance depends on how far the underlying actually tends to move before expiry, not on a round number that sounds safe. In our own measured case above, a seven-fold change in one strike-distance style test moved the daily result by a much smaller amount than changing the signal did, which is the kind of finding a trader can only get from running the numbers, not from reading a general rule.
Margin: What a Short Strangle Actually Ties Up
Margin on a short strangle is calculated differently from margin on an iron condor, and the difference matters more than most explainers admit. A naked strangle has no long wing to cap the loss, so a broker typically charges margin on a naked-coefficient basis — a percentage of notional exposure built to approximate worst-case adverse moves, not a simple multiple of premium collected. An iron condor, by contrast, usually qualifies for defined-risk margin, calculated as the maximum loss on the structure plus a small buffer, because the long wings cap the downside at a known number. That difference in margin treatment is part of why traders reach for the condor in the first place. It is not the same question as whether the condor makes money, which the measured case below answers separately. A ratio structure — more short legs than long ones — sits in between: covered lots get the defined-risk rate, uncovered lots get the naked rate, and treating the whole position as defined-risk overstates how protected it actually is.
The Measured Case: We Sold a Short Strangle Against a Real Signal for 438 Trading Days
Every explainer on the first page of results for this term describes the strangle structure. None of them show what happens when you actually sell one against a real entry signal, with real transaction costs, over a real sample. We ran that test.
The test setup: an RSI(14) oversold cross on NIFTY, backtested on 1-minute data from January 2025 through October 2026, expressed as a short strangle with both legs five strikes out-of-the-money, held through a 30-bar forward window or exited early on a stop. The signal itself fired 19,052 times across 438 trading days. After filtering for one open position at a time and a handful of entry-timing rules, 2,792 of those signals actually became tradeable structures. That sample is worth stating plainly, because reading 19,052 as the trade count would overstate the result by almost seven times.
At zero slippage — the best possible execution a backtest can show, and a figure no real account achieves — the strangle lost 498.83 (approximately $6.00 at a rate of roughly 83.5 rupees per dollar, October 2026) per lot per day over the full 438-day window. We did not stop at zero cost. We also ran the same structure at two realistic per-leg slippage levels, and the loss grew larger at every step up in friction, never smaller. Breakeven slippage — the cost level at which the position would merely break even — does not exist for this structure at this signal. There is no friction level, including zero, at which this particular trade made money.
Why It Lost: the Mechanism, Not Just the Number
58 percent of the short legs in our sample were stopped out before the 30-bar holding window closed. A short strangle leg that stops out and gets replaced is a new round trip. That means a new entry, a new exit, and a new spread paid. At a measured effective spread of 1.89 per leg, a four-leg structure like the iron condor version of this same trade pays that spread eight times over its life. Median credit retention across the sample came in negative, and day win rate at full transaction cost sat in the low single digits out of the 378 days the strategy actually had a position on. None of that is a direction problem. The signal's own measured directional hit rate was 0.5035, a coin flip. That is the expected shape for a signal meant to forecast move SIZE rather than move direction. The loss came from how often the position round-tripped, not from which way the underlying went.
The Counter-Intuitive Part: Buying Protection Made It Worse
We also ran the defined-risk version of the same trade — the iron condor built around the identical short strikes, with long wings four strikes further out. At zero slippage, the condor lost more per day than the naked strangle, not less. The wings cost money on entry and provided no benefit worth that cost, because the signal carried no directional edge for the wings to protect against. A separate structure sweep tested 18 different combinations of short distance, wing distance and stop-loss percentage, bounded to a 40-trading-day window. Zero of 18 combinations cleared a minimum profitability bar. Every single one failed on the same check: average day profitability. Protection on a signal with no directional edge costs money and protects nothing worth protecting. That is a specific, checkable finding from this data set, not a general claim about iron condors as a category.
Common Mistakes When Trading Short Strangle Options
A few mistakes show up repeatedly in how this structure gets described and traded, separate from the specific signal we tested above. Treating a backtest's average day as the expected outcome of every day is one. An average built from 378 trading days hides a worst day far larger than the average, and sizing a position as if every day looks like the average is how a single bad week erases months of collected premium. Ignoring flat days is another. A day with no open position contributes zero to that day's P&L, and dropping those days from the denominator inflates the per-day average on paper without changing what actually happened in the account. Conflating a statistically real signal with a profitable trade is a third, and it is the one our own measured case demonstrates directly: the RSI cross we tested was real on one dimension and still lost money as a short strangle, because the structure's own transaction cost ate the edge before it ever reached the account. Chasing a wider strike distance after a loss is a fourth mistake. Our own data showed that widening the strike distance a great deal barely moved the daily result — for the mechanical reason why, see how delta sets your breakeven width: moving further from the money trades premium for room in a fixed, priced-in way, so chasing width without acknowledging that trade-off just hands back collected premium for very little added protection. A trader who blames strike placement for a loss driven by round-trip count is fixing the wrong thing.
Questions to Ask Before You Trust Any Short-Strangle Performance Claim
Most published short-strangle content never shows a loss. That alone is worth noticing. A structure with defined profit and undefined risk on one side should produce losing periods in any honest sample long enough to include a real adverse move. Before trusting a performance claim for this structure, or any option-selling structure, ask five questions. What is the sample size, in trading days and in number of structures, not just in signals generated? Was a transaction cost modeled, and at what level — zero, modest or realistic? Were flat days counted in the average, or quietly dropped, which inflates the per-day number? Is the single worst day in the sample published, or only the average? And was the test run in-sample against the same data used to pick the rule, or validated out-of-sample against data the rule never saw? A page that answers all five with real numbers is reporting a measurement. A page that answers none of them is reporting a hope.
What This Measurement Does Not Tell You
This test used one specific signal — an RSI(14) oversold cross — on one index, over one roughly 22-month window, with options legs five strikes out-of-the-money. It does not tell you that every short strangle loses money, that every RSI-based entry is structurally unsound, or that defined-risk structures are always worse than undefined-risk ones. It tells you what this signal, on this index, over this sample, actually did when expressed as these two specific structures. Per the Securities and Exchange Commission's investor guidance on options trading, past results — simulated or real — do not guarantee future performance. That caution applies with extra weight to a single signal tested on a single underlying. Our data set does not have bid-ask spread history for every strike traded, so the slippage figures above are a stated assumption rather than a measured market fact. That assumption compounds with every additional leg a structure carries.
Where a Short Strangle Fits in a Toolkit, Not a Recommendation
Nothing in this measurement means short strangle options cannot work against a different signal, a different index, or a different holding period. It means this specific pairing — this RSI rule, sold as this structure, over this sample — lost money at every cost level we tested. The mechanism was transaction count, not wrong direction. Quantzee's own tools exist to run exactly this kind of test against your own rules before you risk capital on an assumption. Our index options indicators guide and volatility index trading guide cover how to read the signals that feed a structure like this one. Our analytics plans page lists the tiers available if you want to run this kind of measurement on a rule of your own. Quantzee provides analytical software, not trade advice, and nothing on this page is a recommendation to open a short strangle position.
Frequently Asked Questions
Source: Quantzee's internal RSI-signal option-selling study, 2,792 structures across 438 NIFTY trading days (January 2025 to October 2026), per the full friction ladder and structure sweep run on the firm's own backtesting engine.
If you want the indicator side of the picture — IV rank, expected move and which chart tools suit sellers versus buyers — read the best TradingView indicators for options traders alongside this result.
Selling NIFTY options on NSE? The NSE options guide covers the Tuesday weekly expiry, the extra expiry-day margin and the 2026 STT rate that sit on top of the costs tested here.