Most answers to "option strangle vs straddle" stop at two facts. A straddle sells or buys both options at the same strike, so it costs more and has a narrower zone. A strangle moves both strikes out of the money, so it's cheaper and wider. That's true, but it also hides an assumption almost nobody states: that the strangle is symmetric. On an equity index it isn't. When we measured a live chain, the "balanced" 16-delta strangle had its lower break-even 1.74 percentage points further from spot than its upper one. This post shows where that lean comes from, how big it was on a real snapshot, and how to check it yourself in about a minute.
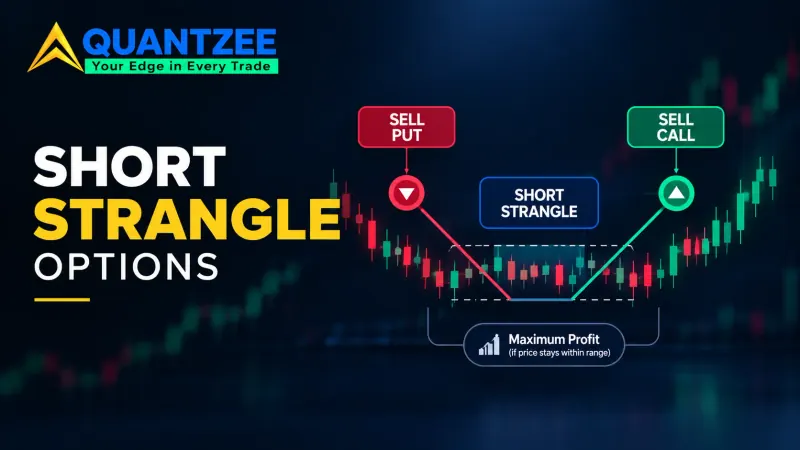
First, a quick split, because the word covers two opposite trades. A long strangle buys an out-of-the-money call and an out-of-the-money put. You pay a debit and need a large move either way. A short strangle sells the same two options. You collect a credit and need price to stay inside a range. The skew lean affects both, but in opposite ways, so keep your side in mind as you read. If you only need definitions and the two payoff shapes, our straddle vs strangle glossary comparison covers that with worked examples. This page is about one thing the glossary doesn't touch: what implied volatility skew does to strangle strike selection.
What is a strangle in options, and where does the straddle fit?
A strangle is two options on the same underlying with the same expiry: one call above spot, one put below. A straddle is the special case where both strikes sit at the money. That single difference drives everything people usually compare: the straddle collects or pays more premium, because at-the-money options carry the most time value. The strangle trades some of that premium for extra room on both sides.
On the snapshot we used below, an at-the-money SPY straddle expiring 18 December 2026 cost $28.49 per share at mid. Its break-evens sat 3.76% either side of spot. The 16-delta strangle on the same expiry cost $6.39 and its break-evens sat at +5.06% and −6.80%. Notice that last pair. The straddle is symmetric by construction, because both legs share one strike, but the strangle isn't, and the payoff diagrams on almost every comparison page draw it as if it were.
Delta-matched is not distance-matched
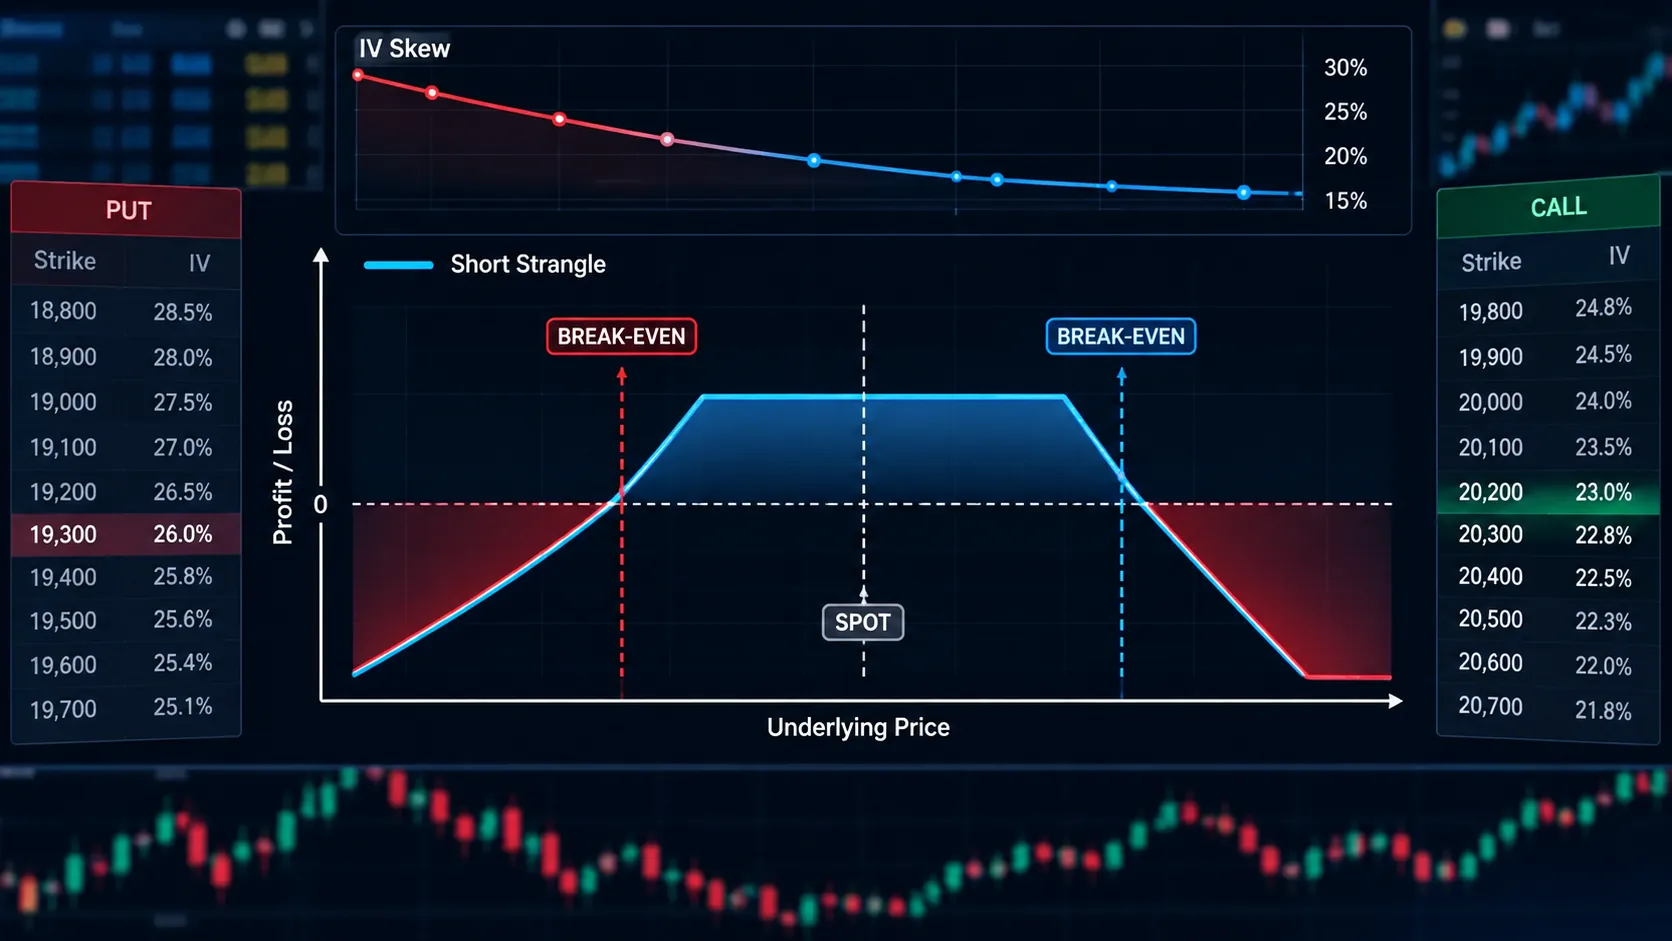
Traders usually pick strangle strikes by delta. The 16-delta call and the 16-delta put feel like a matched pair, roughly a one-standard-deviation move each way. The problem is that delta comes out of a pricing model that uses each strike's own implied volatility. If the put side carries a higher implied volatility than the call side, the 16-delta put has to sit further from spot to get the same delta.
On equity indices that's the normal state. Index puts trade richer than equivalent calls because investors pay up for crash protection, and because indices tend to fall faster than they rise. Per the volatility smile reference on Wikipedia, equity index options have shown this downward-sloping "skew" shape since the 1987 crash. Data from Cboe's own options market statistics pages shows index put volume running well ahead of call volume, which is the demand behind the price.
Here's what that looked like in our data on one specific moment.
How we measured it
Methodology, kept short: we pulled Cboe's delayed-quote option chains for SPY, QQQ and GLD on 12 November 2026, stamped 20:45 UTC (15:45 in New York, so during the regular session). We used the 18 December 2026 monthly expiry, 36 calendar days out. For each underlying we took the call and the put whose published delta was closest to 0.16, and we recorded strike, delta, implied volatility, bid and ask. All premiums below are bid/ask midpoints. Distances are measured from the last price in the same file. This is one snapshot, not a study: a chain is a moment, and the numbers will be different on the day you read this. The structure of the result is what carries over.
We also tried FXE, the euro currency ETF, as a stand-in for a major currency pair. Its chain was too thin to use. The file was stamped hours earlier than the others and the 16-delta options were quoted around $0.10 bid and $0.30 ask, so any midpoint would be noise. We dropped it rather than print a number we don't trust.
The SPY chain, one expiry
| Leg | Strike | Delta | Implied vol | Mid premium | Distance from $757.11 |
|---|---|---|---|---|---|
| 16-delta call | $789 | 0.158 | 11.7% | $2.20 | +4.21% |
| 16-delta put | $712 | −0.159 | 20.7% | $4.19 | −5.96% |
| At-the-money straddle | $757 | — | 14.6% | $28.49 | 0% |
Same expiry, with deltas within 0.002 of each other, yet the put sat $45.11 below spot and the call sat $31.89 above it. That's a 41% wider cushion on the downside. The gap in implied volatility is the reason: 20.7% on the put against 11.7% on the call, a spread of 9 vol points across two strikes that are "the same" by delta.
The put also carried most of the money. Of the $6.39 strangle credit, $4.19 (65.5%) came from the put leg. On one standard 100-share contract, the strangle was worth $638.50, with $418.50 of that on the downside.
Converting the strikes into break-evens and the lean
Break-evens for a strangle add the total premium to the call strike and subtract it from the put strike. The formula is the same whether you're long or short; only who wins outside the range changes.
- Upper break-even: $789 + $6.39 = $795.39, a move of +5.06%.
- Lower break-even: $712 − $6.39 = $705.62, a move of −6.80%.
So the lean is 1.74 percentage points toward the downside. Put another way, a short strangle built this way could absorb a 6.8% fall before losing money at expiry, but only a 5.1% rally. A long strangle needed the market to run 5.1% up or 6.8% down to break even. Neither trade expresses a view by the usual definition, but both of them carry one anyway.
We found the same pattern on QQQ, and slightly sharper in vol terms. Its 16-delta call sat 7.27% above spot at 20.2% implied vol. Its 16-delta put sat 8.30% below at 31.1%. Break-evens landed at +8.67% and −9.71%, and 63.4% of the credit came from the put.
| Underlying | Call IV / put IV | Call distance | Put distance | Upper BE | Lower BE | Put share of premium |
|---|---|---|---|---|---|---|
| SPY | 11.7% / 20.7% | +4.21% | −5.96% | +5.06% | −6.80% | 65.5% |
| QQQ | 20.2% / 31.1% | +7.27% | −8.30% | +8.67% | −9.71% | 63.4% |
| GLD | 23.8% / 26.3% | +8.47% | −7.27% | +9.79% | −8.59% | 54.0% |
GLD is the interesting row, because its lean runs the other way, and that needs a short detour.
Even a flat smile isn't symmetric
Here's something that surprises people. If every strike had the same implied volatility, a 16-delta strangle still wouldn't be symmetric in percentage terms. Prices are modelled as lognormal, so an equal-probability move up is a little larger in percent than an equal-probability move down. Using Black-Scholes with SPY's at-the-money vol of 14.6%, 36 days, and rates ignored, a flat smile would put the 16-delta call about 4.8% above spot and the put about 4.4% below. The natural lean, with zero skew, is toward the upside.
Skew has to overcome that before it flips the structure, and on SPY and QQQ the put premium in vol terms was big enough to swamp it. On GLD, put vol was only 2.6 points above call vol. That wasn't enough to overcome the lognormal effect, so gold's delta-matched strangle ended up with the put closer to spot than the call. Same strategy, same deltas, opposite lean: that's the point worth taking away: the lean is a property of the market you're trading, not of the strangle.
How the lean changes by asset class
Equity indices. Put-heavy skew is the default and it's usually steep. Expect the delta-matched put to sit noticeably further from spot, the lower break-even to be wider, and the put to carry most of the premium. Our SPY and QQQ rows both showed it on the same afternoon.
Major currency pairs. FX options tend to trade a smile that's closer to symmetric, with both wings priced above the at-the-money level. The tilt is quoted as a "risk reversal," and its sign can change with the news flow, because a currency pair has two sides and either one can be the crash currency. A delta-matched strangle there may lean either way, and the lean can change from week to week. We couldn't measure this cleanly on our snapshot, as noted above, so treat it as a structural expectation to check, not a number.
Commodities. Some commodities carry call skew instead, because supply shocks push prices up sharply. Grains around weather scares and energy around supply disruptions are the usual examples. When that happens, the call strike moves further out and the upper break-even widens. Gold on our snapshot sat in between: a mild put premium that the lognormal effect outweighed.
What the lean means for the short seller and the long buyer
For the short strangle seller, the delta-matched version looks balanced on a risk screen. Net delta was close to zero: short a 0.158 call and short a −0.159 put leaves about +0.001. But the price cushion isn't balanced. On SPY, the upside leg was the thin one: 4.21% of room for $2.20 of premium. The downside leg had 5.96% of room for $4.19. In a slow grind higher, the call side gets tested first and it earned the smaller credit. That's the leg being under-compensated if you only look at distance.
There's a fair counter-argument. Index declines tend to be faster and larger than rallies, and the market is pricing that. A seller who widens the put side is being paid for real gap risk. The point isn't that delta-matching is wrong; it's that it quietly makes a choice for you, and you should know which one.
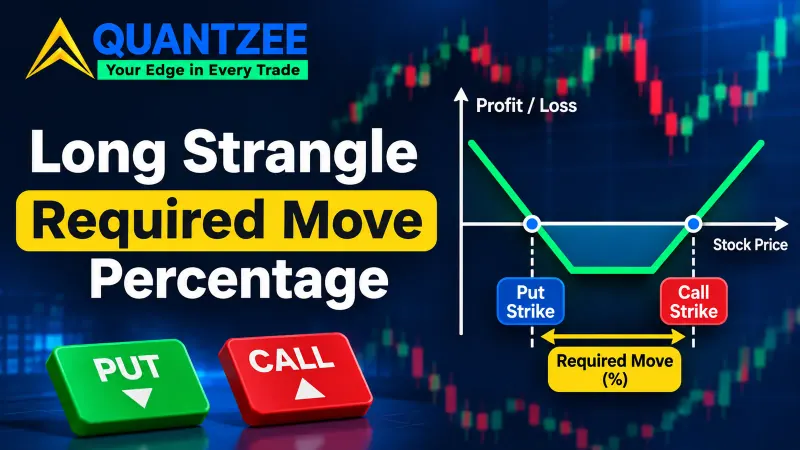
For the long strangle buyer, the effect runs the other way. Most of the debit went into the put, which was priced at 20.7% vol. The call was much cheaper, at 11.7%, so the buyer paid a premium for downside convexity and got upside convexity on sale. If your reason for buying a strangle is "I expect a big move but don't know which way," the skew means you're paying more for one direction than the other. Our long strangle required-move breakdown goes deeper on how large that move has to be.
A strike-selection rule that removes the accidental lean
If you want the break-evens to be symmetric, choose strikes by percentage distance or by break-even distance, not by delta. We compared both on the same SPY chain.
Equal percentage distance (about ±5%). Sell the $795 call and the $719 put. Mids were $1.36 and $4.92, for a credit of $6.28 instead of $6.39. That's $11 less per contract, about 1.7% of the premium. The break-evens moved to +5.83% and −5.86%, which is effectively symmetric.
What does it cost besides the $11? It costs delta, because the $795 call had a delta of 0.109 and the $719 put −0.188. A short strangle on those strikes carried net delta of about +0.08, roughly the same as being long 8 shares of SPY per contract. You've swapped a hidden price lean for a visible delta lean. Many traders prefer that, because a delta number shows up on every risk screen and a break-even asymmetry doesn't.
Equal break-even distance. Pick the pair whose break-evens, after premium, are the same percentage from spot. On this chain that landed very close to the ±5% pair above, because the premium is small relative to the strike gap. On a shorter expiry or a higher-vol market, the two rules separate more, and the break-even version is the one that matches what you actually care about at expiry.
None of these is "correct." Delta-matching keeps you flat on delta right now, while distance-matching keeps you flat on price room, so know which one you're choosing. Our post on strangle cost and break-evens has more worked arithmetic on the cost side.
Why the symmetric payoff diagram misleads
Almost every strangle diagram draws a flat profit plateau with two identical slopes, one each side, starting at equal distances from spot. That picture is accurate for a strangle built at equal distances. It isn't what you get from a delta-matched strangle on an index.
Here's the honest version for the SPY short strangle above, in numbers rather than a drawing. P&L is per share at expiry, ignoring fees; multiply by 100 for one contract.
| SPY move at expiry | SPY price | Short strangle P&L per share | Per contract |
|---|---|---|---|
| −10% | $681.40 | −$24.22 | −$2,422 |
| −7% | $704.11 | −$1.51 | −$151 |
| −5% | $719.25 | +$6.39 | +$639 |
| 0% | $757.11 | +$6.39 | +$639 |
| +5% | $794.97 | +$0.42 | +$42 |
| +7% | $810.11 | −$14.73 | −$1,473 |
| +10% | $832.82 | −$37.44 | −$3,744 |
A 7% fall cost $151 per contract, while a 7% rally cost $1,473. Same strategy, same size move, almost ten times the loss. If you draw it, the plateau sits off-centre to the left of spot, and the right-hand slope starts much sooner than the left. That's the diagram a delta-matched index strangle really has. For the long buyer, flip the signs: the upside pays off sooner than the downside. If you want the full loss case for the short side, our short strangle payoff and measured loss post covers it.
The one-minute chain check before you place the trade
You don't need software for this, since any chain that shows delta and implied volatility per strike will do. It's the same check we ran for this post.
- Note spot and pick the expiry.
- Find the call and put closest to your target delta (for example 0.16).
- Write down each strike's distance from spot as a percentage.
- Write down each strike's implied vol. A gap of more than a few points means skew is doing work.
- Add the two mid premiums. Add the total to the call strike and subtract it from the put strike.
- Turn both break-evens into percentages. Subtract one from the other. That difference is your lean.
- Decide whether you accept it. If not, move one strike until the break-evens match, and note the new net delta and the change in premium.
On SPY this took us less time than it takes to read the list. The first time you do it, the size of the gap is usually the surprise.
Where Quantzee fits
Quantzee builds analytical indicators for TradingView, including tools that help read volatility regimes and price structure on index charts. The index options indicators guide explains how they fit an options workflow. They're decision-support software, not trade signals or advice. Skew itself is something you read from the options chain, and the chain check above works on any platform. For background on how implied volatility is quoted and why it varies by strike, start with our implied volatility glossary entry, then the options Greeks guide for delta itself. Time decay works on both legs of either structure; the theta decay entry covers that.
Options carry real risk, and a short strangle carries risk that isn't capped. Before trading either structure, read the SEC's investor.gov overview of options and the education material from the Options Industry Council, and practise on paper first.