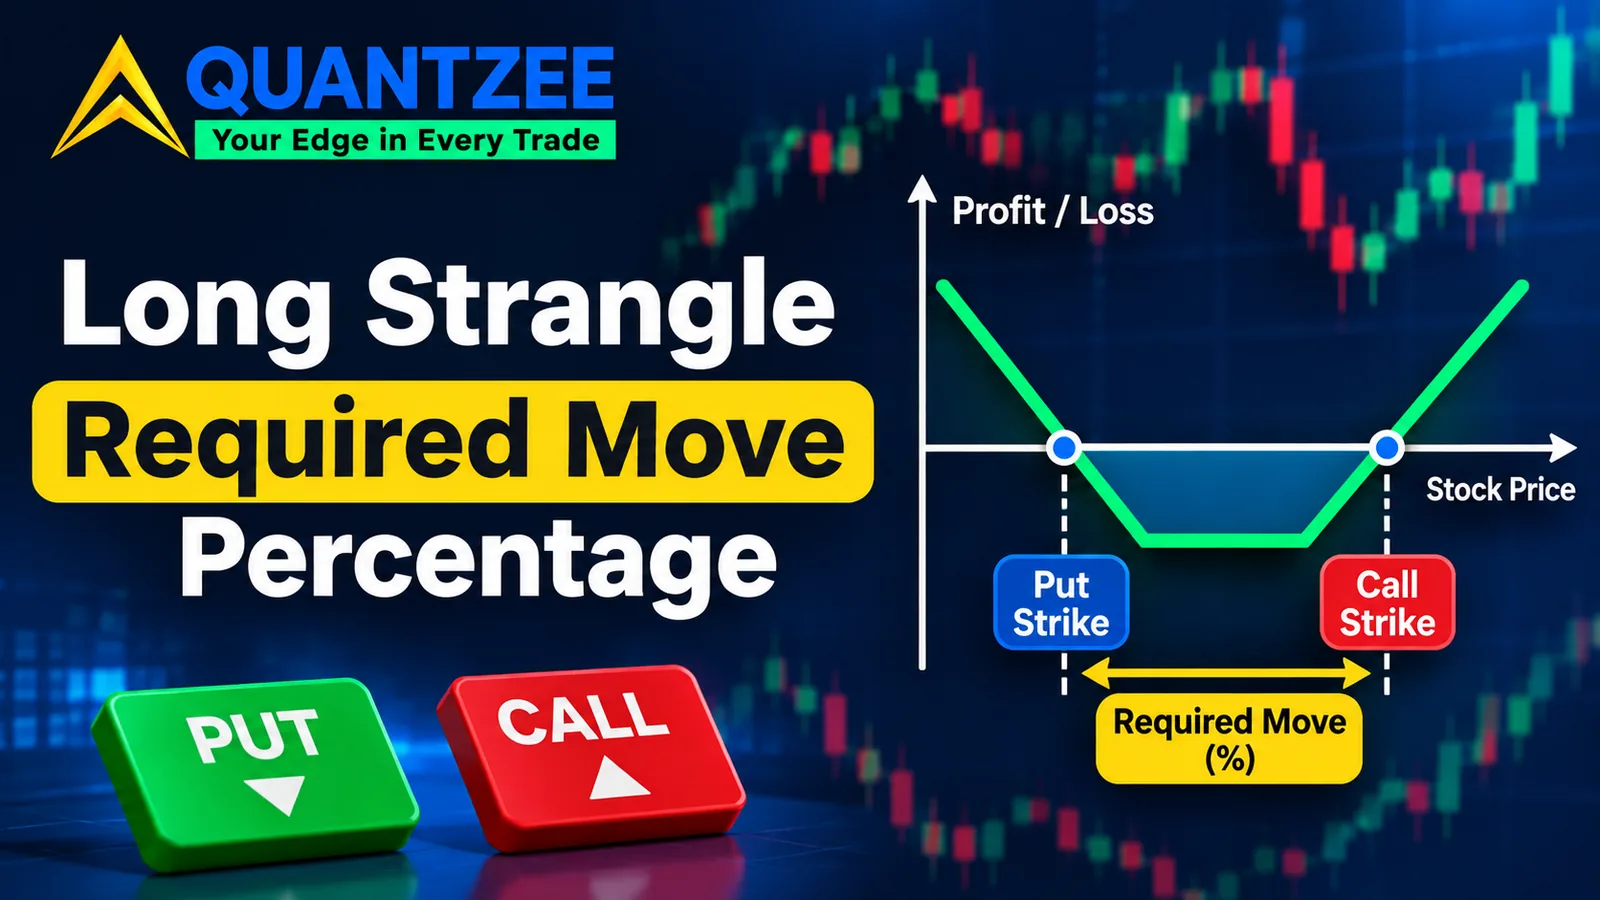
A long strangle options trade is sold almost everywhere as the cheap cousin of a straddle. Buy an out-of-the-money call, buy an out-of-the-money put, cap your loss at the debit, and wait for the underlying to move. Every page ranking for this keyword gives you the two breakevens in dollars and stops there. According to the Options Industry Council and two other sources we checked for this piece, nobody converts those breakevens into the number that actually decides whether the trade is worth placing. That number is the percentage move the underlying has to make, by a stated date, before expiry. Once you write it that way, a long strangle option position stops looking like a cheap bet on movement. It starts looking like a bet on realised volatility beating implied volatility — and the cheaper version of the trade usually asks for a bigger move, not a smaller one.
This piece at Quantzee exists to fix that gap. We built one illustrative options chain, stated as illustrative and not a live quote, then compared two strike selections on it. We also priced the cost that two long legs add on entry and exit, a cost a single-leg trade never pays. Nothing here is a forecast or a recommendation. It's arithmetic applied to a structure that every other page on page one explains only in price terms. The methodology below is simple enough to run on your own underlying in a spreadsheet.
What a Long Strangle Actually Is
A long strangle is built from two legs on the same underlying and the same expiry: an out-of-the-money call bought above the current price, and an out-of-the-money put bought below it. Both premiums are paid upfront as a debit. Max loss is capped at that debit if the underlying sits between the two strikes at expiry. There's no margin call waiting behind this position the way there is on a short strangle — once you've paid for the two legs, the risk is defined and it does not grow.
The payoff shape is a V with a flat floor in the middle. Below the put strike, the position gains dollar-for-dollar as the underlying falls. Above the call strike, it gains dollar-for-dollar as the underlying rises. Between the strikes, it just bleeds premium toward zero as expiry approaches. That's the part every ranking page gets right. What they skip is converting the width of that V into something you can actually use before you pay for it, and the same width-to-priced-move arithmetic for a straddle shows how that conversion works on the pricier cousin.
The Breakeven Everyone Gives You (And Why It's Not Enough)
The standard breakeven formula is simple: call strike plus the total debit paid, and put strike minus the total debit paid. Macroption's worked example on the SERP uses a 45/50 structure costing $3.89 total, landing breakevens at 41.11 and 53.89. Optionalpha's version uses a $100 underlying with a $95 put and $105 call for a $5.00 debit, landing breakevens at $90 and $110. Both are correct. Neither tells you anything about whether that move is likely, large, or small relative to what this particular underlying actually does.
A breakeven in dollars means nothing without a reference frame. $90 is a huge move on a $92 stock and a non-event on a $900 one. The fix is one division: subtract the breakeven from the current price, divide by the current price, and you have the required move as a percentage. That single conversion is the difference between a number you can compare across trades and a number you can only stare at.
Converting Breakeven Into a Required Move
Take our illustrative chain: underlying at $100.00, 32 days to expiry. Structure A buys the $97.50 put for $2.80 and the $102.50 call for $2.95 — a total debit of $5.75. The upside breakeven sits at $108.25, the downside at $91.75. As a required move, that's 8.25% in either direction before this position earns a cent past its cost.
Structure B, on the same underlying and same expiry, buys further out: the $90 put for $1.10 and the $110 call for $1.25, a debit of just $2.35. That's less than half of what Structure A cost. The breakevens land at $112.35 and $87.65 — a required move of 12.35%. Structure B is the cheaper trade on paper and the harder trade to win. It needs the underlying to travel roughly 50% further than Structure A does, for roughly 41% of the price.
Cheaper Isn't Better: Comparing Two Strike Selections
This is the part the three ranking pages we read never show side by side. Optionalpha's strategy library — we checked its LEAPS page too, same publisher, same template — explains payoff shapes but never prices this trade-off. Here's the comparison laid out plainly:
Structure A costs $5.75 and requires an 8.25% move. Structure B costs $2.35 and requires a 12.35% move. If you buy Structure B because it's cheaper, you've actually taken on the position that needs the bigger, less probable move to pay off. A long strangle options trader who shops only on premium is shopping backward. The debit and the required move move in opposite directions by construction — the further out-of-the-money you go, the less you pay and the more you need the underlying to do.
The Real Bet: Implied Volatility Against Realised Volatility
Strip away the direction talk and a long strangle is a bet that realised volatility, measured from now to expiry, will exceed the implied volatility you paid for at entry. Implied volatility is the market's price for how much the underlying will move, the same number a VIX-style volatility index is built to read at the index level rather than on one underlying. When you buy two OTM options, you're paying that price upfront. You win if the underlying moves by more than the market priced in; you lose if it moves by less, even if it technically crosses one of your strikes, because the premium already baked in roughly that much wiggle.
This is the identity the SERP never states. Our glossary on implied volatility covers how the number is derived. What matters here is simpler: the debit you paid is a direct translation of that number into dollars. A 20% implied volatility environment prices a materially smaller required move than a 45% one, on the same underlying, at the same strikes. Check the current implied volatility before comparing two strangles across different weeks. Comparing debit alone across different volatility regimes is comparing apples priced in different currencies.
The Volatility Collapse Trap Around Scheduled Events
Here's the mechanism most retail explainers skip entirely: implied volatility is often inflated ahead of a known event — earnings, a Fed decision, an FDA ruling — because the market is pricing in uncertainty about the outcome, not just about direction. The moment the event resolves, that uncertainty premium can evaporate within minutes, even before the underlying has finished moving.
Say implied volatility sits at 42% the morning of an earnings release and the debit on our Structure A reflects that. The stock gaps 6% overnight — a real, sizeable move by most standards — but implied volatility collapses to 24% the moment the print is out, because the uncertainty that justified the higher number is gone. Both legs can lose value in that collapse even though the underlying moved in the direction you'd hoped. This is the single most common way a long strangle options position disappoints a trader who got the direction and the size roughly right. Being correct about the move and still losing money is the defining risk of buying volatility into a known catalyst.
Theta Decay on Two Long Legs
Both legs of a long strangle are long options, so both decay every single day the underlying sits still. Decay is not linear. It accelerates as expiry approaches. In our illustrative Structure A, the combined theta on day one of the 32-day window might run around $0.11 a day across both legs. By the final week, if the underlying is still sitting between the strikes, that daily bleed can roughly double or triple as the time value compresses into its last few sessions. The theta decay glossary page on Quantzee breaks down why the curve bends this way rather than falling in a straight line, and the same bend shows up in the options Greeks that drive it.
This has a direct planning consequence. A long strangle option bought with 32 days left and held passively through all 32 is fighting its hardest decay in exactly the days closest to expiry. Those are the same days a trader is often tempted to "give it more time." The holding plan, not just the strike selection, decides whether decay or movement wins the race.
The Hidden Cost of Four Spread Crossings
Every single-leg option trade crosses the bid-ask spread twice: once on entry, once on exit. A long strangle has two legs, so it crosses the spread four times — twice on each leg. None of the three ranking pages we read — not Optionalpha, not Macroption, not the Options Industry Council's own strategy page — mentions this cost once.
On a liquid underlying with a $0.02 spread, four crossings might only cost $0.08 total, a rounding error against a $5.75 debit. On a thinner chain with a $0.10 spread on each leg, four crossings cost $0.40 — on Structure B's $2.35 debit, that's roughly 17% of the entire position gone to spread before the trade has moved an inch. The cheaper the structure, the larger the spread cost as a share of the premium, which compounds the exact problem Structure B already has: it's the trade that needed the bigger move, and now it's also the trade where execution cost eats the largest percentage of capital.
Strike Selection Is the Real Decision
Put the pieces together and strike selection stops being about "how much can I afford" and becomes a trade-off: what this structure costs versus what it then requires the underlying to do, in a stated window, measured against that underlying's own typical range — the same kind of weighting problem a risk-adjusted return metric has to settle before it can rank two strategies rather than just reporting the raw number. A trader who only asks the first half of that question is pricing the position with one eye closed. In our experience building out these comparisons, the strike pair that looks attractive on cost alone is almost always the one with the required move furthest from what the underlying has recently done — which is exactly the comparison a required-move percentage makes visible and a dollar breakeven hides.
Long Strangle vs. Short Strangle: Not the Same Position
It's worth separating this clearly because the two get blurred constantly. A long strangle pays a debit and caps loss at that debit. A short strangle collects a credit and carries open-ended risk with a margin obligation behind it — the measured loss case we ran on an actual short strangle shows what that open-ended side costs when it goes wrong. They are not the same trade with the sign flipped. The risk profile, the capital requirement, and the role of implied volatility are inverted. Our glossary page on straddle versus strangle covers this distinction in full. Assignment and exercise mechanics that apply to both sides are covered by the Financial Industry Regulatory Authority's investor education materials, which is where we'd point you rather than a blog if you need that detail sourced from an industry body rather than a strategy site. The short version is a different risk posture entirely, and this page is specifically about the long side.
How Often Does the Required Move Actually Happen?
We don't have a measured study of how often an 8.25% or 12.35% move actually occurs on a given underlying over a 32-day window, and we're not going to print a number we can't support. What we can give you is the method, because it's one you can run yourself on the specific instrument you're trading rather than trusting a generic average that doesn't apply to your underlying:
- Pull the daily closing prices for your underlying going back at least 252 trading days — roughly one year.
- For every 32-day window in that history (overlapping is fine), calculate the percentage move from the start of the window to the end.
- Count how many of those windows moved at least as far as your required move, in either direction.
- Divide that count by the total number of windows you checked. That ratio is your base rate for this specific underlying and this specific window length — not a market-wide average, not a number from a different ticker.
Run this before you buy, not after. It takes a spreadsheet and about ten minutes, and it replaces a guess with an answer specific to the thing you're actually trading.
Where Quantzee Fits
Quantzee's toolkit is built for traders who want to see volatility, strike selection, and required-move math laid out before they commit capital, not after. None of this replaces your own judgment about a trade, and nothing here is a signal, a tip, or an expected return — it's the arithmetic every long strangle trader should run before paying the debit, regardless of which platform they execute on.
To check whether the required move is realistic before you pay, compare it with the expected move built from IV, as shown in the best TradingView indicators for options traders.