Gamma is how much an option's delta changes when the underlying moves one point. Delta is the speed, gamma is the change in speed. That is the whole definition, and every options page on the internet gives it to you in the first paragraph. What most of them skip is the part that matters once you are actually holding a position: gamma is the rate at which the number you sized your trade on goes stale, which is exactly what hurts a seller in a short straddle as expiry approaches.
Last updated: 10 November 2026. Every figure below is an illustrative calculation from a stated starting point (a Black-Scholes model, a $100 stock, 20% implied volatility, zero interest rate), not a market quote. We built the tables ourselves so you can see the mechanics; none of it is a live chain.
What is gamma in options, in one sentence?
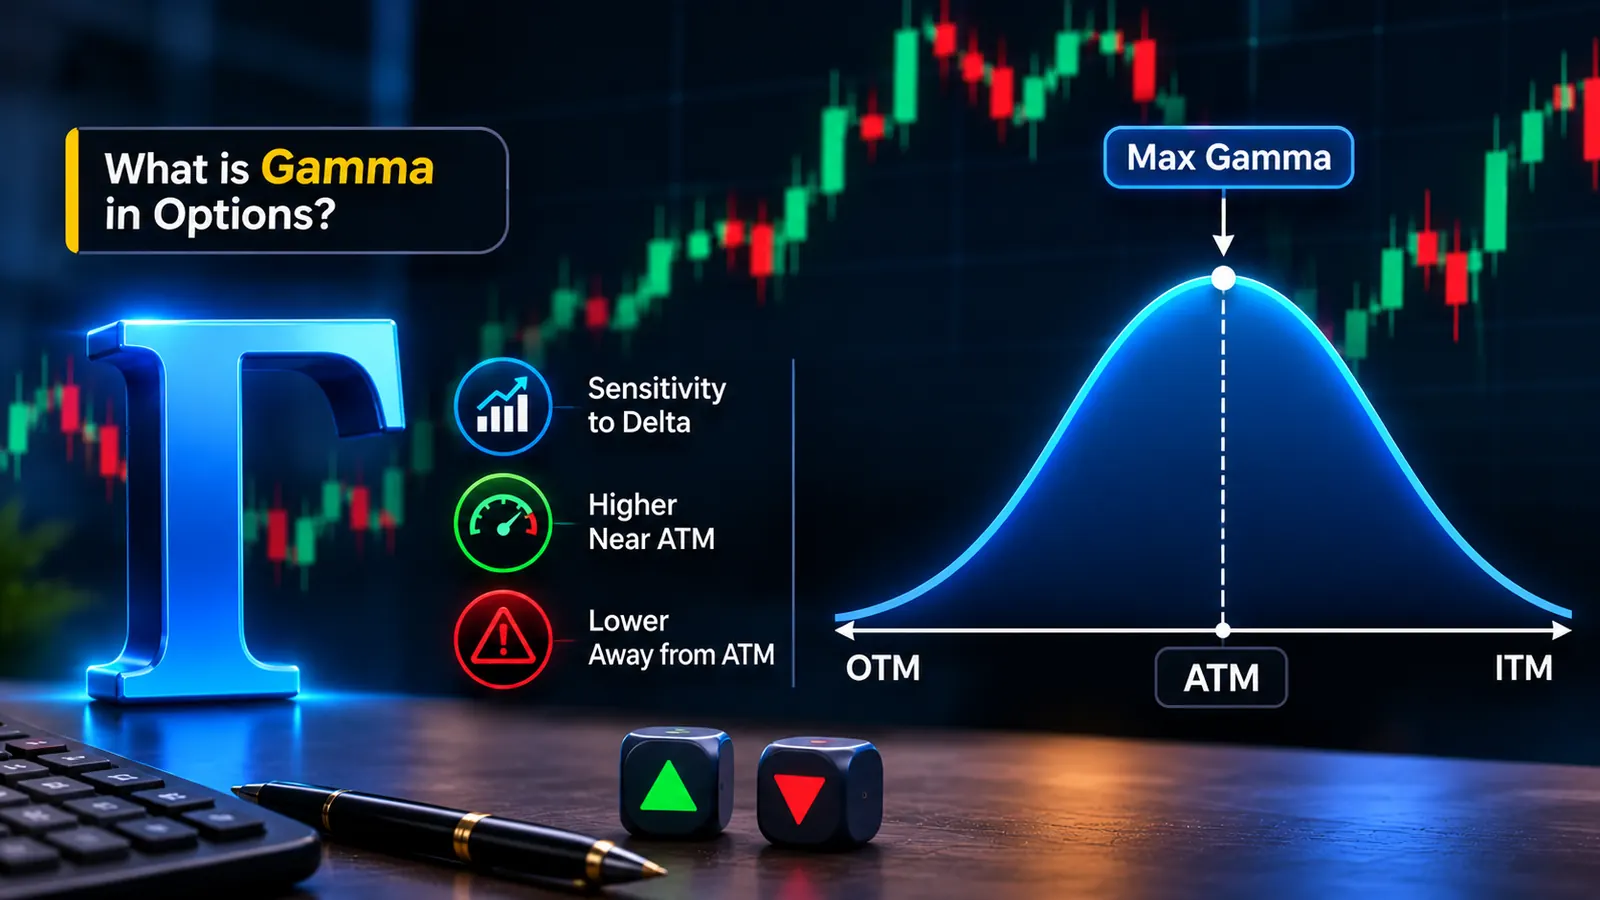
Gamma measures the change in an option's delta for a one-point move in the underlying. If a call has a delta of 0.50 and a gamma of 0.10, a one-point rise in the stock lifts the delta to about 0.60. A one-point fall drops it to about 0.40.
Delta tells you how much the option's price moves per point. Gamma tells you how quickly that "how much" is changing. According to the Options Industry Council, the Greeks are the standard way to describe an option's sensitivities, and gamma is the one that describes the curvature of the position rather than its slope. Our own options Greeks glossary entry covers all five side by side; this post goes deep on one.
The textbook example, the one tastytrade and a dozen others use, is a single step: a call at 0.20 delta and 0.05 gamma becomes 0.25 delta after a one-dollar rise. It is correct. It is also where the explanation usually stops, and the stopping point hides the useful part. Real prices do not move one dollar and quit. They keep going, and gamma keeps rewriting delta at every step.
Long gamma, short gamma, and the sign that confuses everyone
Here is where beginners trip. Gamma printed on a chain is almost always a positive number, for calls and puts alike. A 100-strike call and a 100-strike put with the same expiry have the same gamma. That is because the number is quoted per contract, as a property of the option itself, not of your position.
Your position's gamma depends on which side you are on.
- Long a call or a put: positive gamma. Your delta moves in your favour as the stock moves.
- Short a call or a put: negative gamma. Your delta moves against you as the stock moves.
Buy a call and the stock rises: your delta grows, so you are effectively getting longer into the rally. Sell that call and the stock rises: your short delta grows, so you are getting shorter into the rally. The first feels like a tailwind. The second is how a manageable loss turns into an unmanageable one. The writer of the Trading Block long versus short gamma piece frames it the same way: long gamma gains from movement, short gamma pays for it.
The delta-drift table: gamma over several moves, not one
This is the part we think the single-step examples miss. We built a small table using Black-Scholes with the stock at $100, a $100 strike call, 20% implied volatility and zero rates. Then we compared three expiries: 30 days, 7 days and 1 day. For each, we stepped the stock up and recomputed delta from scratch at every price.
| Stock price | Delta, 30 days left | Delta, 7 days left | Delta, 1 day left |
|---|---|---|---|
| $98 | 0.37 | 0.24 | 0.03 |
| $99 | 0.44 | 0.36 | 0.17 |
| $100 | 0.51 | 0.51 | 0.50 |
| $101 | 0.58 | 0.65 | 0.83 |
| $102 | 0.65 | 0.77 | 0.97 |
| $103 | 0.71 | 0.86 | 1.00 |
| $104 | 0.76 | 0.92 | 1.00 |
| $105 | 0.81 | 0.96 | 1.00 |
Read it column by column. With 30 days left, delta crawls from 0.51 to 0.81 across a five-dollar rally. A position sized on 0.51 delta is carrying about 58% more directional exposure by $105. Noticeable, manageable, slow.
With 7 days left, the same five-dollar rally takes delta from 0.51 to 0.96. The exposure has nearly doubled. By $103, three dollars up, the call already behaves like 86 shares of stock per contract instead of 51.
With 1 day left, it is over in two dollars. Delta goes 0.50, 0.83, 0.97. The option that was a coin flip at $100 is stock by $102. And on the way down, the same contract loses almost all its sensitivity: 0.03 at $98.
The gamma values at $100 behind this table are about 0.07 at 30 days, 0.14 at 7 days and 0.38 at 1 day. That is a 5x jump in gamma between a month out and the last day, for the same strike and the same volatility. Nothing about the underlying changed. Only the calendar did.
Why is gamma highest at the money, and what happens near expiry?
Gamma is largest where the outcome is least certain. An at-the-money option is a coin flip on whether it finishes in or out of the money, so a small move in the stock swings the odds a lot. A deep in-the-money option is almost certain to finish in the money; another dollar barely changes that. A far out-of-the-money option is the mirror image. In both tails, delta is pinned near 1 or near 0, so there is almost nothing left for gamma to change.
We ran the strike dimension too, holding 7 days to expiry and the same $100 stock. Gamma at the 100 strike is about 0.144. Move to the 98 or 102 strikes and it falls to roughly 0.11. At 95 or 105 it is about 0.03. At 90 or 110 it rounds to zero. The gamma curve over strikes is a narrow hump centred on the stock price, and it gets narrower and taller as expiry approaches.
The time dimension is the other half. At the 100 strike, our model gives gamma of about 0.05 at 60 days, 0.07 at 30, 0.10 at 14, 0.14 at 7, 0.22 at 3 and 0.38 at 1 day. The curve is gentle until the last two weeks and then it bends hard.
The practical consequence: for a zero-days-to-expiry position, delta is nearly useless as a planning number. If the contract is within a point or two of the strike, the delta you see on the screen can be 0.50 now and 0.95 in a few minutes. Anything built on "my delta is 0.50" is describing a state that will not last.
What gamma does to a stop-loss
A stop placed at a fixed price on the underlying does not correspond to a fixed loss on the option. People assume it does because the stock stop feels like a clean rule. The option's sensitivity shifts on the way to that level, so the loss at the stop depends on how much gamma the position had along the path.
Take the 7-day call from the table, bought at the $100 strike. Suppose your plan is to exit if the stock falls to $98. Using the delta column: at $100 delta is 0.51, at $99 it is 0.36, at $98 it is 0.24. If you had assumed a constant 0.51 delta, you would expect to lose about $1.02 per share over that two-dollar fall. Using the average delta over the path (roughly 0.43), the loss is nearer $0.86. A difference of about 16% in the stop loss estimate for a two-dollar move, from gamma alone, and it widens fast with longer paths.
Notice which way the error runs. For a long option the stop loss is smaller than the naive estimate, because delta shrinks as you lose, so gamma is cushioning you. The danger is the mirror case for a short option, where the same fall in delta works in your favour but a rise hurts more than expected. Anyone who has read our piece on how theta decay works will recognise the shape: the Greeks are not independent dials, and each one changes the meaning of the others.
The short-gamma problem for option sellers
Option sellers collect premium and, in exchange, take negative gamma. In a quiet market that is a good deal. In a fast one, it is a trap that closes slowly and then all at once.
Walk through it with the 1-day column. You sell a $100 call with one day left, collecting a small premium. The stock is at $100, your short delta is about 0.50 per share. You hedge by buying 50 shares per contract. Then the stock rises to $101. The call's delta is now 0.83. Your hedge of 50 shares is short 33 shares of delta. You are short exposure into a rising market with a hedge that was right a minute ago. If you rebalance to 83 shares at $101 and the stock then falls back to $100, delta drops to 0.50 and you now hold 33 too many shares, which you sell at a loss. That round trip is the cost of being short gamma: you buy high and sell low as part of staying hedged.
The loss is not a flaw in your execution. It is the price of the position, which is why short options near expiry demand smaller size than the Greeks at entry suggest. A delta of 0.50 and a modest premium look harmless at the open. The 1-day gamma of 0.38 says the position can become 0.97 delta in a two-dollar move.
In our experience of building these tables, the number that surprises people is not the peak gamma. It is how little room there is: two dollars on a $100 stock is 2%, an ordinary day for many single stocks.
Gamma and theta are the same trade seen from two sides
Positive gamma is not free. Long options pay for their curvature with time decay. The 7-day at-the-money call in our example has a gamma of 0.144 and loses a visible slice of its value every day as theta; the 30-day call has half the gamma and decays more slowly per day. More gamma means more theta, and the two scale together.
From the seller's side the same relationship flips. Negative gamma is rewarded with positive theta: you are paid to sit through the swings. Whether that payment is enough depends on whether the stock actually moves more or less than the implied volatility priced into the option. That is the question our implied volatility glossary entry is built around. Gamma and theta together describe one exchange: curvature for time. If you want to see how this plays out on structures rather than single legs, our straddle versus strangle comparison is the natural next read, because a straddle is almost pure gamma and theta.
Why dealer gamma matters even if you never trade options
Market makers who sell options to the public hold the other side, and their hedging can add to or damp price moves. When they are net long gamma they tend to trade against the move, which calms prices. When they are net short gamma they tend to trade with it, which amplifies prices.
The catch matters as much as the idea. According to SpotGamma's explainer on gamma exposure, public open interest does not tell you who owns what, so dealer positioning has to be inferred under an assumption about which side each trade was on. Treat any "dealer gamma" level as an estimate built on that assumption, not a measurement. For the full treatment of aggregate gamma exposure, read SpotGamma's page rather than relying on a second summary here.
Where to read gamma on a chain, and one caution
Most broker option chains have a Greeks column you can switch on. Look for gamma next to delta and theta, and compare the at-the-money strike across two expiries. The jump you saw in our table will be right there on the screen.
The caution is that gamma is model output, not market data. Nobody trades gamma and no exchange prints it. Your platform computes it from the option's price, a volatility estimate, the interest rate and dividends, using its own model. Two platforms can show slightly different gamma for the same contract because their volatility inputs differ. Use it as a sizing guide, not a precise fact. If you want to see how the options Greeks tie into index-level analysis, our index options indicators guide shows how Quantzee's toolkit frames them. Quantzee is analytical software, not advice, and nothing here is a recommendation to trade any contract.
For a quick sanity check on your own position, try this once: pick the contract you hold, note its delta, then find the delta of the same strike one dollar higher and one dollar lower. The size of the gap is your gamma, and it is the honest answer to "how wrong will my sizing be after a few more points?" The U.S. SEC's investor education site is also worth a bookmark for the risk-disclosure side of options before you size anything.