Wyckoff trading is usually taught as one block. You get the composite operator, the three laws, the four phases, the schematic and the five-step routine, all in one long read, all presented as equally usable. They aren't: some of those parts can be applied to a bar that just closed, while others only make sense once the move is over and you're looking back at it.
This post splits the Wyckoff trading method into its five parts and gives each one a grade. The grade answers one question: can you label it from bars that have already closed, without knowing what happens next? If yes, it's live; if only some of it passes, it's partial; and if you need future bars to apply it, it's hindsight. Quantzee builds analytical software for chart readers, so that question is the one we care about most. A label you can only apply after the fact can't drive a decision you have to make before the fact.
Short version if you're skimming: use the four-phase cycle and the cause-and-effect range as context. Stop using the spring and the composite operator as triggers. The rest of the post shows why.
Why the ranking guides don't sort the method
Three long guides lead search results for "wyckoff trading" right now. The atas.net piece runs about 4,200 words, the bookmap.com piece about 6,500, and the tradingsim.com piece about 3,500. They're well made, two of them carry annotated charts and all three have an FAQ, but each treats the method as one system you either use or don't.
The bookmap guide comes closest to the problem. It admits that real charts rarely match the schematic exactly, then moves on without saying what that means for a trader looking at a live chart. The tradingsim guide is the only one of the three that offers a rule for telling a spring from a real breakdown. Its rule needs low volume on the break and an immediate reversal, and both of those are things you only know once the next bar has printed.
That's the analytical gap in the current guidance. A 1930s method built for reading ticker tape got turned into a diagram, and the diagram got taught as if every point on it were visible in real time. Our team doesn't think it is, and the grades below show which parts survive the test.
How we scored each part
Our methodology is simple enough to run on your own charts. For each part of the method, we asked three things:
- Can the part be defined using only bars that have closed?
- If it can, is the definition precise enough that two readers would draw the same label on the same bar?
- Does the label change once later bars arrive? If it does, it was never a live label in the first place.
A part that passes all three is graded live. A part that passes the first but fails the third is graded partial or hindsight, depending on how often the label flips. There's no hit-rate claim in this post. We hold no census of Wyckoff phases across markets, so there's no frequency number to quote, and any page that gives you one should show you its sample.
For the accumulation phases themselves, we've already published this grading in detail. Our post on which Wyckoff accumulation phases you can identify live walks through all eight events one by one. This piece is the map that sits above it.
Part 1: The composite operator — hindsight (an interpretation aid, not a signal)
Wyckoff asked students to picture the market as if one large operator were running it. That operator accumulates quietly, marks price up, distributes into strength, then marks price down. According to the Wyckoff Analytics teaching material, the composite operator is a way to think about the market's behaviour, not a literal person or a measurable force (Wyckoff Analytics overview).
That's the right way to hold it, because the composite operator helps you ask a useful question: who would benefit from this move, and who is being shaken out? But you can't write it as a rule, since there's no bar condition for "the operator is accumulating." Any time you attach that phrase to a chart, you're describing a story you've already decided on. Two readers looking at the same range can tell opposite stories with the same vocabulary, and nothing on the chart settles the argument.
Final classification: hindsight. Keep it as a reading habit, and don't let it decide an entry.
Part 2: The three laws — graded one at a time
Most guides grade the three laws together, as if they stand or fall as a set. They don't, because one is definitional, one is measurable, and one is the hardest of the three to pin down.
The law of supply and demand — live, but it tells you little on its own
Price rises when demand exceeds supply and falls when supply exceeds demand. That's true by definition, which is why it passes the live test without effort. It's also why it isn't a signal: every closed bar already shows the result of supply meeting demand, so the law explains the bar without predicting the next one. Use it as the reason volume and spread matter, not as a setup.
The law of cause and effect — partial, and it's arithmetic you can run
Per the Wyckoff Analytics summary, the size of a trading range (the cause) relates to the size of the trend that follows it (the effect). This is the part of the method most often waved at and least often measured. It can be measured, though, and here's how to do it on your own chart in about an hour.
Take a range that has already finished. Count its duration in bars, say 40 bars. Measure its height, say from 100 to 108, so 8 points. Then measure the move that followed the breakout until the next range formed, say 100 to 124 in the other direction, or 108 to 130. Write down three numbers: duration, height, and the size of the move after. Do that for 20 or 30 finished ranges on one instrument and one timeframe. You'll quickly see whether longer ranges on that market tend to lead to larger moves, and how loose the relationship is.
Why only partial? Because you can measure the cause while the range is still forming, but you can't know when it's finished. A range that's 40 bars old today might run to 90 bars. The cause is live, but the effect is still a projection until the range ends. That makes cause and effect useful for sizing your expectations, and weak for timing.
The law of effort versus result — partial, read bar by bar
Some lists name this as the third law in place of the composite operator, and it's the better candidate. Effort is volume and result is price movement. If a bar prints heavy volume but price barely moves, effort and result disagree, and that disagreement is worth noting. This can be read on every closed bar. What it can't tell you is which side won the disagreement until later bars show it, so it's live to observe and hindsight to interpret.
The composite operator, which some guides lump in with the laws, is neither definitional nor measurable. That's why it sits in its own section above.
Part 3: The four-phase cycle — live as a state label, not as an entry
Accumulation, markup, distribution and markdown, in that repeating sequence. This is the cycle at the core of Wyckoff trading, and it holds up better than the schematic does, as long as you use it the right way.
Here's the right way to use it. Once a range is clearly in progress, you can label the market state from closed bars. Price stopped trending, it's moving sideways between two levels, and volume behaviour inside the range is changing. That's a state you can name today without seeing tomorrow. "We're in a range after a decline" is a live, checkable label.
The wrong way is to use the phase label as a trigger. "This is accumulation, so I'm buying" requires you to know that the range will resolve upward. You don't know that, because a range after a decline can be accumulation or it can be re-distribution before another leg down. The label only becomes certain once the breakout has happened.
So the cycle earns a split grade. As a filter, it's live: it tells you which setups from your other tools deserve more weight. As an entry, it's hindsight. When we apply the four-phase label to a chart, we treat it the way you'd treat a weather forecast. It shapes the plan, but it doesn't pull the trigger.
Distribution adds its own wrinkle, because it isn't a mirror of accumulation. Markdowns tend to move faster than markups and volatility often widens into the top instead of quieting. If you're reading a top, our post on the asymmetries between Wyckoff distribution and accumulation covers why a flipped schematic leads people to short too early.
Part 4: The schematics — mixed grades, and the spring is the weakest
The accumulation and distribution schematics are the part people picture when they hear "Wyckoff." Nine or so labelled events, from preliminary support through the last point of support. Our accumulation post grades each event, so the conclusions carry over here without the worked detail.
In short, the events fall into three groups:
- Live, or close to it: the selling climax, when volume is clearly abnormal and the bar closes well off its low, and the sign of strength, a breakout through resistance on expanding volume. Both can be read the moment the bar closes. The sign of strength lags, since the range is already over, but it's real.
- Partial: preliminary support and the test of the spring. You can flag a candidate live. Whether it stands depends on what comes next.
- Hindsight: the automatic rally, the secondary test, the spring itself, and the last point of support. Each is defined at least partly by what does not happen afterward.
Why the spring is the method's weakest live call
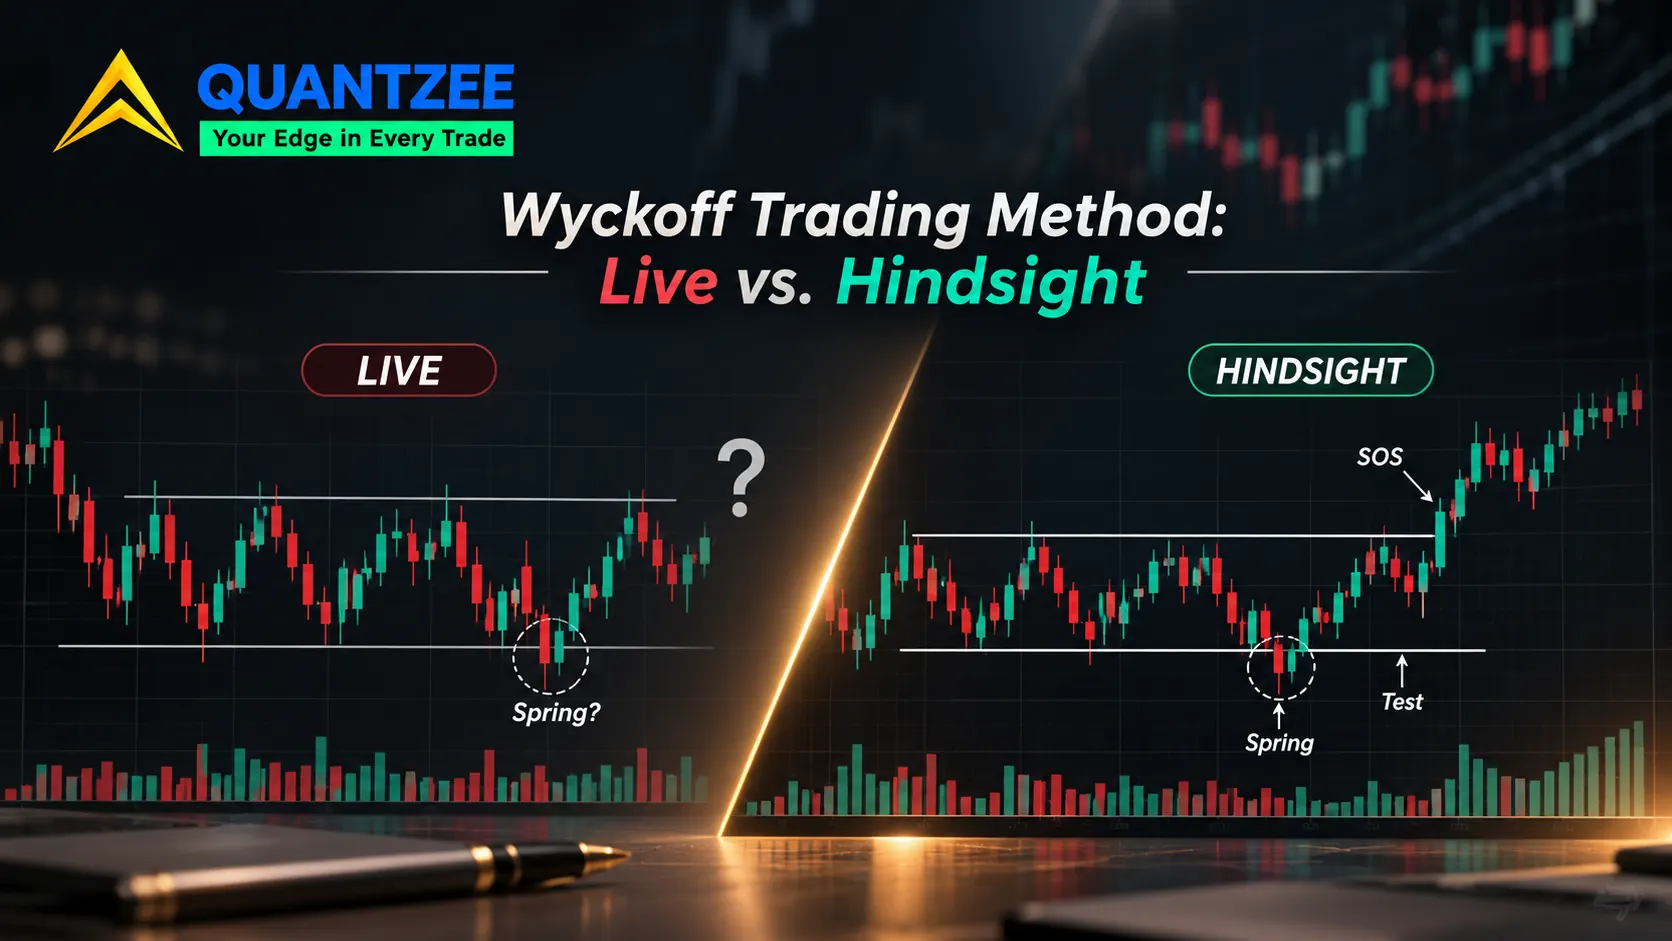
The spring is the most famous Wyckoff entry, and it's the one that fails the live test hardest. A spring is a break below range support that recovers back into the range. A real breakdown is a break below range support that doesn't recover. At the moment price is below support, those two events look the same, because they're literally the same bar.
The only thing that separates them is the recovery bar. And the recovery bar closes after the point where a spring entry is supposed to happen. If you wait for the recovery to confirm it, you're no longer buying the spring but the move back into the range, which is a different trade with a different stop and a different risk.
That's the exact problem with the tradingsim rule we mentioned earlier. Low volume on the break and an immediate reversal are both true of good springs, but you learn the second one a bar late. We wrote a separate piece on the three conditions a Wyckoff spring has to meet, and even with those conditions, the call is one you make after the recovery, not before it.
Our own interpretation: treat a break below support inside a trading range as a notification, not an entry. If price recovers and closes back inside the range, you now have a closed-bar fact to work with. That's a slower trade, and a more honest one for anyone who has to decide before the next bar prints.
Part 5: The five-step routine — mostly live, with one hindsight step
Wyckoff's five-step approach to choosing a stock is the most practical part of the method, and the one modern guides spend the least time on. In plain terms, as laid out by Wyckoff Analytics:
- Work out the position and likely direction of the broad market.
- Pick instruments in step with that direction, stronger than the market in an uptrend or weaker in a downtrend.
- Choose those with a "cause" at least equal to your target.
- Judge whether the instrument is ready to move.
- Time your commitment to a turn in the broad market or index.
Steps 1 and 2 are live. Trend direction and relative strength can be computed from closed bars. A ratio of the instrument to its index, or a simple comparison of returns over 20 or 60 bars, settles the question without any future data.
Step 3 is partial, for the reason covered under cause and effect: you can measure the range so far but not its final size.
Step 4 is where hindsight creeps back in. "Ready to move" usually means the instrument has finished its range, which in practice means you're waiting for a spring, a test or a sign of strength. Only the last of those is a clean live read.
Step 5 depends on spotting a turn in the index, which carries the same live-versus-hindsight problem as any phase label. A turn is obvious a week later, but on the day it's a guess with some context behind it.
Final classification: mostly live through step 2, partial at step 3, and mixed afterward. Of the five parts, this is the one that adapts best to a rules-based process, which is probably why it gets so little space in the long guides.
The scorecard
| Part of the method | Grade | Use it as |
|---|---|---|
| Composite operator | Hindsight | A reading habit. Never a rule. |
| Law of supply and demand | Live, but definitional | The reason volume matters |
| Law of cause and effect | Partial | Expectations for move size |
| Law of effort vs result | Partial | A bar-level warning sign |
| Four-phase cycle | Live as a state, hindsight as a trigger | A filter on other signals |
| Selling climax / sign of strength | Live (sign of strength lags) | The cleanest schematic reads |
| Spring | Hindsight | An alert, then wait for the recovery bar |
| Five-step routine, steps 1-2 | Live | Screening |
| Five-step routine, steps 3-5 | Partial to hindsight | Planning, not timing |
Count it up and about half the method is something you can act on from a closed bar. The other half is a narrative you can only finish once the move is done. Neither half is useless, since they just do different jobs, and mixing them up is where most Wyckoff trading goes wrong.
What to keep, what to stop doing
If you take two practical conclusions from this page, take these.
Keep the context parts. The four-phase state label, the cause-and-effect measurement, effort versus result on each bar, and the first two steps of the routine all work on closed data. They make your other signals better by telling you which ones to trust more in the current state.
Stop using the narrative parts as triggers. "The operator is accumulating" and "that was a spring" are conclusions, not entries. If your trade plan starts with either phrase, it's starting with something you can't know yet.
This matches what we found when auditing smart money concepts more broadly. Our post on which SMC ideas survive a rule test lands in a similar place: the parts that can be written as a rule are the parts worth keeping, and much of SMC descends from Wyckoff's ideas. The same logic shows up in our review of the AMD trading strategy against real sessions, where the accumulation-manipulation-distribution story is easy to see afterward and much harder to call while it's happening.
For readers who want the live parts on the chart instead of in a notebook, Quantzee's SMC Toolkit Pro plots structure, liquidity sweeps and range boundaries from closed bars. It won't tell you a break below support is a spring, because nothing honest can. It will show you the break, the sweep and whether price closed back inside the range, which is the closed-bar fact the spring section above says to wait for.
One additional caution about historical context. Richard Wyckoff (1873-1934) built this method for reading markets in his own era, and the Wikipedia biography is a fair starting point on his background. The U.S. Securities and Exchange Commission's investor education site, Investor.gov, makes the general point that past price behaviour doesn't guarantee future results, and that applies to every label on this page. The CMT Association still includes Wyckoff in its technical analysis curriculum, which says the ideas are worth learning. It doesn't say the schematic is a signal. Paper trade any process built on these grades before it touches real money.