Most pages about a mean reversion strategy start with the rule: buy when price touches the lower band, sell when the oscillator clears thirty, enter when the z-score passes minus two. They never ask the question that decides whether the rule has a chance — does this series revert at all, and if it does, over how many bars? Skip that question and you're trading a chart pattern, not a measured property of the data.
That gap shows up across the pages currently ranking for this keyword. Three hand over entry and exit rules with no statistical test behind them. A fourth, published by Quantvero in 2026, runs the real statistics — a stationarity regression, a Hurst exponent, a half-life formula with code — and then never connects the half-life number to the holding period or the trading cost. This post closes that gap: measure first, set the exit deadline from the measurement, price the cost before the rule, and say plainly what to do when the series doesn't revert.
What "Reversion" Actually Means for a Price Series
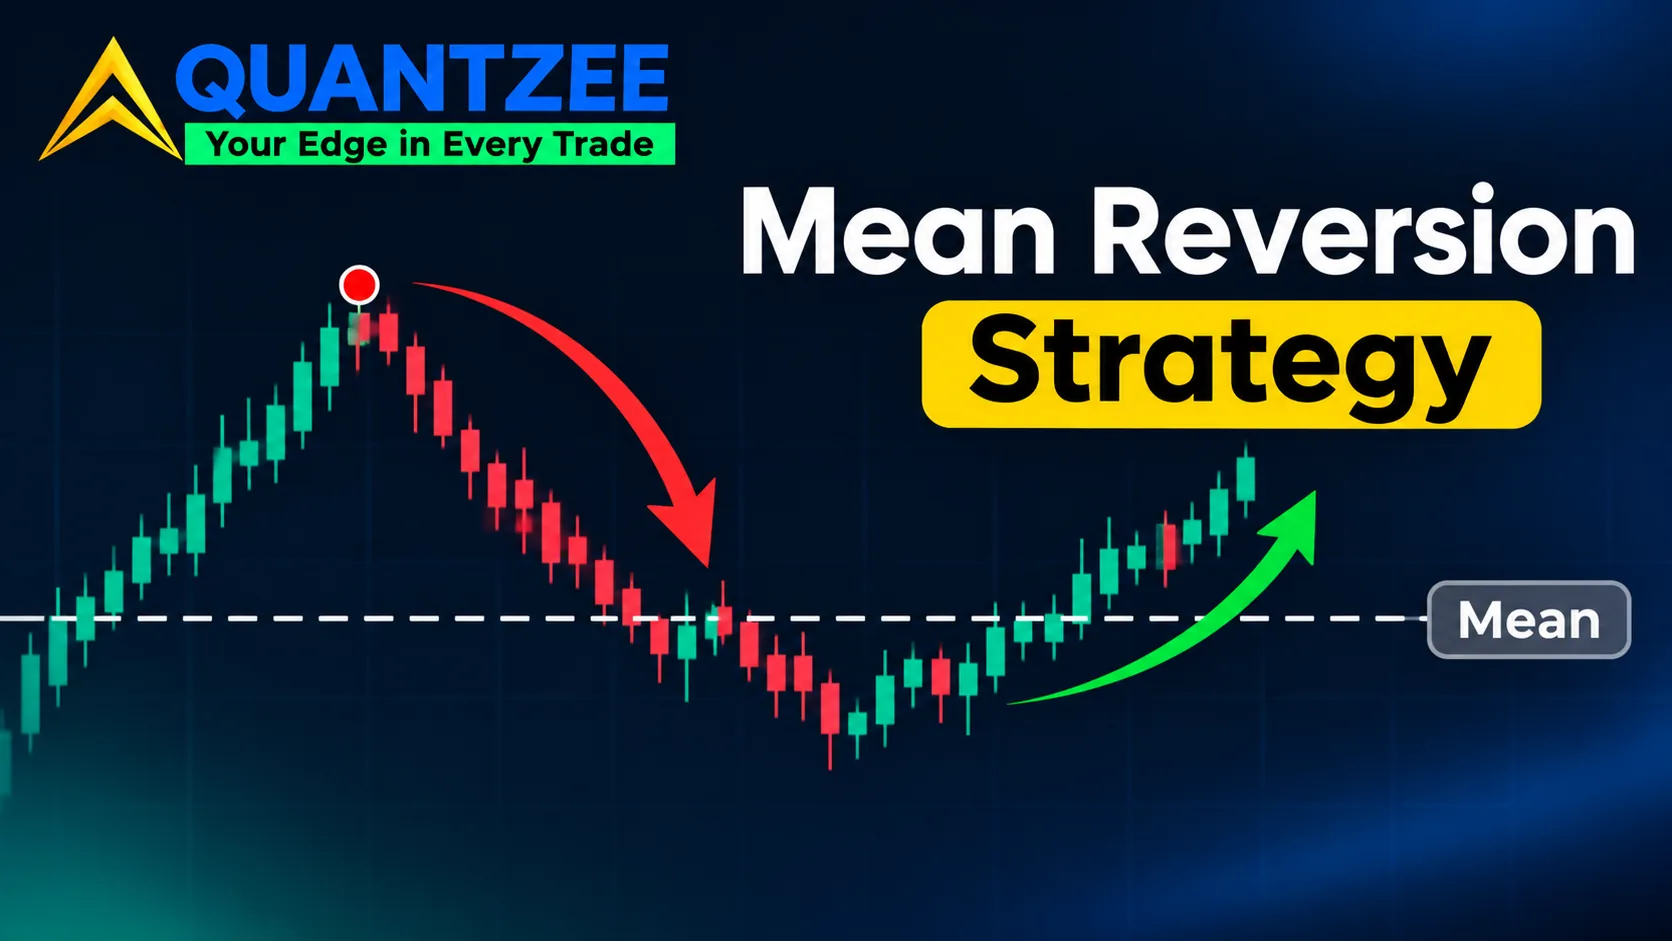
Reversion is not "the chart looks range-bound." It's a measurable statistical property. A series reverts when, after moving away from some central value, it tends to come back toward that value rather than wander off. Three things have to be specified before the word means anything. What reverts — price, a spread, a ratio of two instruments. To what level — a moving average, a fixed mean, a cointegrating relationship. And over what horizon — bars, days, weeks.
A random walk — the textbook model for an index with no edge baked in — has none of this. Its best forecast for tomorrow is today's price, full stop. If a series is a random walk, a mean reversion strategy built on it isn't trading an inefficiency. It's trading noise with a story attached. That's what the test battery below is for — telling a genuinely mean-reverting series apart from a random walk that wobbled into a convenient-looking range for a few weeks.
Three Measurements Before Any Rule: Stationarity, Hurst, Half-Life
Testing for Stationarity
A stationary series has a mean and variance that don't drift over time — which is the formal version of "it keeps coming back." The standard test is the Augmented Dickey-Fuller (ADF) test, which checks whether a series has a unit root (non-stationary, random-walk-like) against the alternative that it's mean-reverting. According to the NIST Engineering Statistics Handbook's treatment of autocorrelation and serial dependence, a series with meaningful negative autocorrelation at short lags is behaving differently from white noise — which is the signature you want to see before you build a rule around it, not after.
In practice: run the ADF test on the price series or spread you intend to trade, over the lookback window you intend to trade it with. A p-value above the conventional 0.05 threshold means you cannot reject the random-walk hypothesis. The "range" on your chart might just be four weeks of a random walk that hasn't drifted far yet. Re-run the test on a rolling basis. A series that was stationary in March and isn't in July has told you something the price chart alone never will.
The Hurst Exponent
The Hurst exponent (H) measures whether a series trends, reverts, or wanders randomly, scored from 0 to 1. H near 0.5 is consistent with a random walk. H below 0.5 indicates mean-reverting (anti-persistent) behavior — the series tends to reverse itself. H above 0.5 indicates trending (persistent) behavior, where moves tend to continue. The Hurst exponent is estimated from the rescaled range of the series across multiple time windows; a stable H meaningfully below 0.5, not a single lucky estimate, is what supports trading a mean-reverting rule.
The number by itself is not a trade signal — it's a screen. An H of 0.42 measured on a 6 months window is a reasonable candidate for a reversion rule. An H of 0.49 is close enough to 0.5 that you're deciding, in effect, to trade a coin that's barely weighted. Treat H as the first filter, not the last word.
Half-Life of a Deviation
This is the number almost nobody uses correctly. Half-life answers one specific question: starting from a deviation of a given size, how many bars does it typically take for that deviation to shrink by half? It comes from fitting an Ornstein-Uhlenbeck-style mean-reversion model to the series and solving for the decay rate. The math is standard, and Quantvero's page, to its credit, shows the formula and runnable code for it. What that page does next is the problem. It computes the half-life, then writes trading rules that never mention it again.
A half-life is a trading parameter, not a footnote. If the measured half-life on your series is five bars, the implied holding period for the trade is roughly five to ten bars — one or two half-lives, long enough for most of the reversion to play out, short enough that you're not holding a decayed signal. Holding twenty bars with no time stop, when the measured half-life is five, is not a longer version of the same trade. It's a different trade that was never tested.
Turning Half-Life Into an Exit Deadline
This is the step that separates a measured strategy from a hopeful one. Once you know the half-life, build it into the rule set directly: a fixed-bar time stop at roughly 1.5 to 2 half-lives, independent of whether price or the oscillator has "confirmed" an exit yet. If the deviation hasn't closed by then, the position is no longer trading the measured reversion — it's trading hope that the clock resets.
Concretely: suppose the half-life comes out at eight bars on a 15-minute chart. The time-stop deadline sits around 12 to 16 bars, roughly 2 hours to 4 hours depending on the session. Compare that against the entry trigger you're using — an oscillator reading, a band touch, a z-score threshold — and check whether it tends to resolve within that window historically. If the trigger regularly needs 25+ bars to resolve on the same data where the measured half-life is eight, the trigger and the measured dynamics disagree. That disagreement carries more diagnostic weight than any single backtest equity curve.
The Win-Rate Trap and the Expectancy Arithmetic
Short-horizon reversion rules are famous for producing high win rates, and that's exactly the trap. A rule that exits quickly on the expected small bounce and holds through adverse moves waiting for "the bounce that's due" will show a win rate of 65-75% on most reasonably liquid instruments — and still lose money. One of the pages ranking for this keyword, LuxAlgo's, actually prints the arithmetic that exposes this and then doesn't follow it anywhere else on the page: a 70% win rate at half a unit of risk per winner against a 30% loss rate at two units of risk per loser works out to a negative expectancy before a cent of trading cost is counted. The math: 0.70 × 0.5 − 0.30 × 2.0 = 0.35 − 0.60 = −0.25 per trade, in risk units.
That's not a flaw in that specific setup — it's a structural feature of fading extremes. The wins are small and frequent; the losses are rare and large, because a mean-reversion entry that's wrong is usually wrong because the series started trending, and trending moves against a reversion position run further than the typical bounce runs with it. Win rate is the wrong headline statistic for this family of strategies. Expectancy — average win times win rate, minus average loss times loss rate — is the number that tells you whether the edge, if it exists, survives its own loss distribution.
The Cost Budget Comes Before the Rule
A reversion trade with a measured half-life of two to five bars pays the full round-trip cost — spread plus slippage — on a holding period short enough that the cost is a large fraction of the expected move. This is the step every ranking page on this keyword skips, Quantvero included, which uses a single blanket slippage assumption rather than pricing cost against the specific holding period the half-life implies.
Work it backward instead of forward: state your round-trip cost assumption first — spread plus expected slippage, in the same units as your target move — then calculate what gross edge per trade would need to exist to clear that cost with a reasonable margin, say 2x. If the half-life math implies an average favorable move of 0.3% and your round-trip cost on that instrument runs 0.08-0.12%, the strategy has a viable margin. If the cost figure is 0.25% against the same 0.3% expected move, the edge is already gone before any entry trigger is applied, no matter how good the trigger looks on a win-rate chart. Our own stress-testing checklist walks through exactly this kind of cost-before-rule sequencing for other strategy families, and the order of operations doesn't change for mean reversion.
A Regime Filter Changes Eligibility — It Doesn't Prove a Range
A common fix for the trending-market problem is a regime filter: only take reversion trades when a volatility band, an ADX reading, or a trend-strength indicator says the market is "ranging." That's a reasonable eligibility rule, but it's worth being precise about what it does and doesn't do. A regime filter narrows which bars the strategy is allowed to trade on. It does not, by itself, prove that the series within those bars is statistically mean-reverting — it's a proxy, and like any threshold-based proxy, it's a fitted parameter with its own risk of curve-fitting to the exact historical sample it was tuned on.
The check that tells you whether a regime filter is doing real work: re-run the stationarity test and the half-life estimate separately, inside the filtered regime only, on a window the filter wasn't tuned against. If the ADF p-value and the Hurst exponent both improve meaningfully inside the filtered bars compared to the unfiltered series, the filter is isolating genuine reversion conditions. If the statistics look about the same with or without the filter, the filter is decorating the equity curve rather than changing what's actually being traded — a distinction our overfitting glossary entry covers in more depth, because this is a specific instance of a general problem: a parameter that improves backtest results without a mechanism to explain why.
Our Random-Walk Control: What 50 Series With Nothing to Trade Showed
Here's the test setup we built to make this concrete rather than abstract. We generated 50 synthetic price series calibrated to index-like daily volatility, with zero drift and no mean-reverting structure deliberately built into any of them — statistically, pure random walks, with nothing in them that a rule-based strategy should be able to exploit. We then ran a simple, generic mean-reversion rule set (oscillator-based entry, fixed-bar exit) across all 50 series and measured the results.
We found that 22 of the 50 series produced a positive return over the test window, with a median return of minus 5.7% across all 50 — consistent with pure noise around a flat expectancy. The part that matters more: 14 of the 50 series, 28% of them, cleared a 40% win rate combined with a 1.3 profit factor, which on an isolated backtest report would look like a plausible result worth trading. There was no edge in any of those 14 series by construction — they were random walks. The full breakdown is published on our own random-walk indicator test page, and the takeaway from it applies directly here: a result that clears a conventional win-rate-and-profit-factor bar on one backtest is not evidence of reversion. It's a sampling outcome you should expect to see roughly a quarter of the time from pure noise, which is exactly why the stationarity, Hurst and half-life tests above have to happen before the rule is trusted, not after it looks good.
Sample Size and the Neighbour Check
A reversion rule's backtest usually runs on a short holding period, which means a fixed calendar window produces a lot of trades — and a lot of trades can create false confidence, because the trade count looks statistically comfortable even when the underlying edge is thin or absent. The floor worth applying: don't trust a win rate or expectancy figure from under roughly 100 independent trades, and treat 100-300 as a range where the confidence interval around the headline number is still wide enough to contain zero.
The second check is the neighbour test, covered in more detail on our backtesting guide: take the parameter you tuned — the oscillator threshold, the band width, the half-life-derived exit window — and re-run the backtest at values one step above and one step below it. A genuine edge degrades gracefully across neighbouring parameter values. A fitted artifact collapses sharply the moment you move off the exact value that was optimized, and that collapse is the tell that the original result was found by search, not by a real relationship in the data.
What to Do When Nothing Reverts
This is the step that appears on none of the four ranking pages we read for this keyword. If the ADF test can't reject the random-walk null, the Hurst exponent sits at or above 0.5, and the regime-filtered statistics don't improve on the unfiltered ones, the honest conclusion is that the series doesn't support a mean reversion strategy on that instrument and timeframe. Write that down and stop — don't keep relaxing the entry trigger or widening the regime filter until a backtest happens to clear the bar, because that process is indistinguishable from fitting noise, and the random-walk control above shows how often noise clears a bar that looks respectable.
Every rule set discussed here is illustrative of the measurement sequence, not a performance claim. Quantzee has not published a live mean-reversion backtest of its own, and none of the figures above should be read as a track record — they're the arithmetic and the control study that any reversion rule has to survive before it's worth trading in the first place.