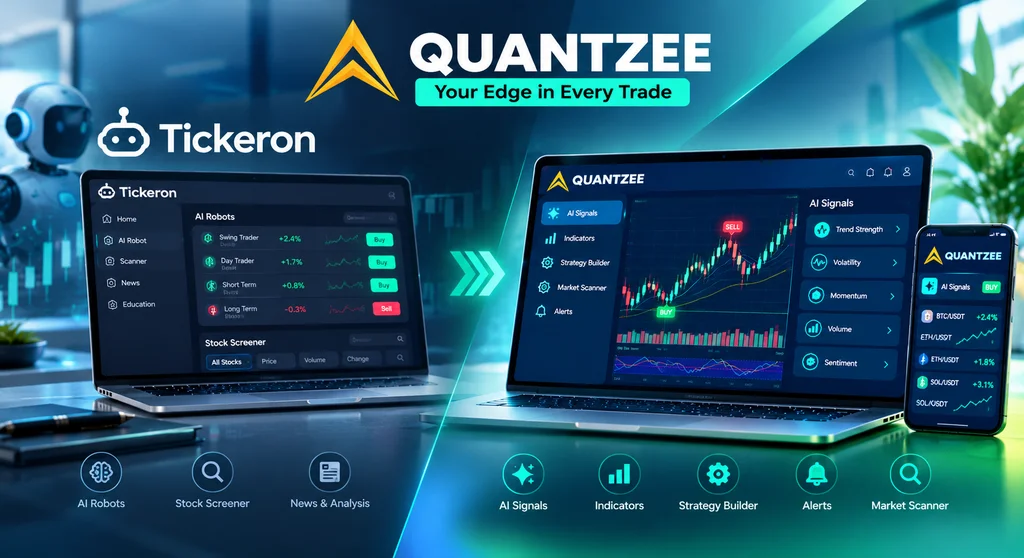
Searching for a Tickeron alternative for TradingView, or comparing Tickeron vs Quantzee pricing? Tickeron’s per-tool annual pricing can total up to $1,170/year across bundled tools (~$97/mo effective), and it renews. Quantzee is one payment of $59.99 covering all 6 indicators — about 5% of a single Tickeron year, with no per-tool math and no renewal. Read on for the full comparison.
A signal flashes a strong buy. You enter. The market moves against you, you check the chart, and the signal has quietly vanished or flipped to neutral. The same indicator that gave you a confident green arrow an hour ago now shows nothing — because the subsequent candles “invalidated” the setup, and the tool rewrote its own history. That is not a technical analysis problem; that is a repainting problem, and it is one of the most common complaints traders raise about AI-labeled indicator platforms in 2026.
Tickeron is a well-known AI trading platform that has attracted a large user base with its pattern recognition and “AI Robot” technology. Whether it is the right tool for your workflow — and whether Quantzee is a better alternative — depends on what specifically is causing friction. This page covers what Tickeron actually does, how its pricing works in practice, the most common user concerns, and how Quantzee’s approach differs.
⚡ Key Takeaways
- Tickeron uses per-tool annual pricing — the AI Robot Bundle alone costs $870/year, and traders using multiple tools easily exceed $1,170/year, making it one of the highest-cost AI signal platforms available.
- Tickeron's published confidence percentages (e.g., "72% probability") are historical pattern completion rates, not forward-looking probability for the current trade — current market conditions are not factored in.
- Community reports note that some Tickeron signals change or disappear after candle close — the definition of repainting — meaning live trading results can differ significantly from the historical chart.
- Quantzee uses forward-calculated, non-repainting logic — all signals lock at bar close and are independently verifiable on TradingView's Bar Replay in under 5 minutes.
- Quantzee covers all TradingView markets, with the full 6-indicator suite for one payment of $59.99 and the Pine Script source emailed to you.
Top 4 Alternatives to Tickeron in 2026 (Quick Comparison)
If you’re comparing Tickeron against the field rather than just against one competitor, here’s where it sits relative to the other tools traders in this category most often shortlist:
| Rank | Tool | Category | Starting Price | Notable Limitation / Fit |
|---|---|---|---|---|
| 🏆 1 | Quantzee | AI signal indicators (TradingView) | $59.99 once — Pine source emailed, no renewal | Non-repainting, verifiable on Bar Replay, covers crypto, stocks, forex & commodities |
| 2 | Tickeron | — | ~$97/mo ($1,170+/yr) | per-tool AI bot fees stack up fast |
| 3 | 3Commas | Related tool in this category | See full comparison | Different feature/price tradeoff — worth shortlisting alongside Tickeron |
| 4 | AI Signals | Related tool in this category | See full comparison | Different feature/price tradeoff — worth shortlisting alongside Tickeron |
Quantzee tops this list on price-to-signal-clarity ratio — $59.99 paid once against Tickeron’s ~$97/mo ($1,170+/yr), with non-repainting logic you can verify yourself before paying. The detailed, feature-by-feature comparison against Tickeron specifically follows below.
What is Tickeron?
Tickeron is an AI-powered market analysis platform that uses machine-learning pattern recognition to surface trade setups, track pattern completion rates, and generate buy/sell signals across stocks, ETFs, crypto, and forex. Its primary appeal is breadth: many different tools under one subscription, covering multiple markets and timeframes.
Core Tickeron features
AI Pattern Recognition: Tickeron’s pattern engine scans for classic technical patterns — head and shoulders, cups and saucers, flags, pennants, double tops and bottoms — and calculates historical completion rates for each pattern type. When a pattern is identified, it reports a probability of the pattern completing to the target.
AI Robots (Algorithmic Trading Bots): Tickeron’s AI Robots are pre-built algorithmic strategies that generate buy and sell signals in real time. They are segmented by market (stocks, ETFs, crypto, forex) and by signal frequency (15-minute, 60-minute, end-of-day). Robots have published performance metrics on the Tickeron platform.
Trend Prediction Engine: This module attempts to predict directional price movement over a set time horizon using historical patterns. Predictions include a confidence level and a price target.
Indicator Agents: A collection of momentum, trend, support/resistance, and volatility indicators that flag potential entry and exit points. These are closer to traditional technical indicator logic than to machine learning, though they are presented under the AI umbrella.
Paper Trading Integration: Users can paper-trade signals in a simulated environment without risking real capital. This is a genuine positive — it allows systematic testing before live deployment.
Multi-asset market coverage: Stocks, ETFs, crypto, and forex are covered across the core tools.
What Tickeron is used for in practice
Based on community discussions across Reddit (r/Daytrading, r/StockMarket), TraderLion, and StockTwits, Tickeron’s most common use cases are:
- Retail stock traders using the pattern scanner to supplement manual chart reading
- Swing traders using AI Robot signals as a first filter before their own technical analysis
- Newer traders attracted by the AI framing looking for a simplified signal source
- Research-oriented traders using the historical pattern completion rate data as a statistical reference
Tickeron pricing in 2026
Tickeron’s pricing structure is tool-by-tool rather than a single flat subscription. Each product category has its own price, which creates a meaningful risk of accumulating significant annual spend:
| Tool | Annual Price |
|---|---|
| AI Robot Bundle (all 15min + 60min Robots) | $870/year |
| Time Machine in AI Screener | $240/year |
| Real-Time Patterns + AI Robots for Crypto | $210/year |
| Pattern Search Engine (end-of-day) | $180/year |
| Trend Prediction Engine (end-of-day) | $180/year |
| Real-Time Patterns — Stocks and ETFs | $120/year |
| AI Screener | $120/year |
A trader who subscribes to the Robot Bundle plus Real-Time Patterns for Stocks plus the Trend Prediction Engine is already at $1,170/year — more than many comprehensive alternatives. The modular structure makes it easy to underestimate total spend.
There is also a free tier with limited access, and some features are available as short trials. The pattern completion data (which patterns have historically completed to their target, and at what rate) is available without a full subscription and is often the entry point that draws traders in.
Why traders seek Tickeron alternatives
The most frequently cited concerns in Tickeron community reviews and forum discussions:
Signal repainting
Community reports — including discussions on Reddit and StockTwits from users testing Tickeron signals live — note that some Tickeron signals and indicator outputs change after the fact. Specifically: a signal that appeared on a bar while that bar was live sometimes looks different after that bar has closed and subsequent bars have printed. This is the textbook definition of repainting.
Tickeron’s pattern completion rates (published on the platform) are based on historical data across many pattern occurrences — that methodology is sound as a statistical reference. But when a signal is derived from a pattern that may re-evaluate after close, the live trading experience diverges from what the historical record suggests. This is a well-documented issue with AI pattern recognition tools that use multi-bar pattern confirmation logic: the pattern’s start and end points can shift as more bars arrive, changing the signal retroactively.
Confidence percentages that mislead
Tickeron publishes confidence levels with its signals — percentages like “72% probability of reaching target.” These are based on historical pattern completion rates, not on a forward-looking probability model. The distinction matters: a 72% historical completion rate for a head-and-shoulders pattern does not mean the current instance has a 72% probability of completing. It means that in the historical dataset, 72% of similar-looking patterns eventually completed. Current market conditions, news context, and the specific characteristics of this instance are not factored in. Users who treat these figures as predictive probabilities rather than historical base rates can make position-sizing decisions based on false precision.
Decision fatigue from indicator volume
The modular structure that makes Tickeron flexible also creates a problem: users who subscribe to multiple tools across the same market face a constant stream of sometimes-contradicting signals. Pattern engine says bullish. Trend Prediction Engine says neutral. Robot gives a sell. For a beginning or intermediate trader, reconciling these into a single decision is not simplified analysis — it is multiplied analysis. The pattern that repeats in community discussions is traders subscribing to more tools in the hope that more coverage means more edge, then finding themselves more confused, not less.
Per-tool pricing complexity
As noted above, the modular pricing means there is no simple “one subscription covers everything” answer. This makes comparing Tickeron’s true cost against alternatives harder — the headline number is lower than the effective number for a trader who uses multiple tools.
Tickeron pros and cons
Where Tickeron genuinely delivers:
- Pattern recognition database with historical completion rates is a legitimate statistical resource
- AI Robot performance is published on-platform, which is more transparency than many signal providers offer
- Paper trading is available, letting users test signal quality without capital risk
- Multi-asset coverage (stocks, ETFs, crypto, forex) without additional per-feed costs
- Active development with new AI Robot additions over time
Where traders find limitations:
- Signal repainting on some tools — live experience may differ from historical chart
- Confidence percentages represent historical base rates, not true forward probabilities
- Modular pricing leads to unexpectedly high total cost for traders using multiple tools
- High indicator volume creates decision fatigue rather than clarity
- Some “AI” indicator agents are essentially standard technical indicators rebadged
No per-tool math. One $59.99 payment gets you every Quantzee indicator, not a subset — and the source code with it.
Meet Quantzee: the alternative for clarity and non-repainting signals
Quantzee takes the opposite architectural philosophy from Tickeron: fewer tools, cleaner signals, and a strict non-repainting commitment that is independently verifiable on your chart.
The Quantzee approach
Non-repainting by design: Quantzee’s indicators are built on forward-calculated logic. Signals are computed at bar close and are never re-evaluated based on subsequent bars. You can test this directly on TradingView: screenshot any signal the moment it fires, advance the chart by ten candles, and look back at that bar. The signal will be identical. This is not a policy claim — it is a testable guarantee.
Fewer, better-filtered signals: Rather than offering ten overlapping indicator types that can contradict each other, Quantzee’s suite is designed around a coherent signal hierarchy. The AI Adaptive Quant Toolkit produces one primary signal per chart, with confidence context (trend regime, volatility, squeeze state) visible in an on-chart dashboard. One well-filtered signal per chart is more actionable than ten competing signals.
On-chart SL/TP levels: SuperTrend Pro+ auto-plots an ATR-based entry, stop-loss, and take-profit ladder directly on the price chart — no separate platform or alert stream required.
Cross-market coverage on TradingView: Quantzee works across all TradingView markets (stocks, forex, crypto, indices, commodities) from the one $59.99 purchase. There is no per-market add-on and nothing to renew.
Where to start
Quantzee’s suite is fully paid — $59.99 once, no free tier or trial. The lowest-friction way to evaluate it: add any indicator, such as SuperTrend Pro+, to a TradingView chart and run the non-repainting test before you buy.
Tickeron vs Quantzee: direct comparison
| Feature | Tickeron | Quantzee |
|---|---|---|
| Signal Integrity | Some repainting reported in community reviews | Non-repainting — forward-calculated, locked at bar close |
| Signal Volume | High — multiple tools can produce conflicting signals | Low — one clear primary signal per chart |
| Confidence Grading | Historical base-rate percentages | Regime dashboard (trend state, volatility, squeeze) |
| On-Chart SL/TP | Not built in to most tools | Auto-plotted via SuperTrend Pro+ |
| Pricing Model | Per-tool annual subscriptions — can accumulate | Single subscription covering all TradingView markets |
| Multi-Market | Stocks, ETFs, crypto, forex (per-tool) | All TradingView markets (stocks, forex, crypto, indices) |
| Paper Trading | Available | Via TradingView’s own paper trading |
| Free Entry Point | Limited free tier; trial tools | No trial — one $59.99 purchase |
| Repainting Verification | Difficult — pattern boundaries shift | Testable directly on TradingView |
Who should use which tool?
Tickeron may suit you if:
- You specifically want AI pattern recognition with historical completion rate data as a research reference
- You are trading stocks and ETFs primarily and the AI Robot signals match your timeframe
- You want to paper-trade a pre-built strategy before committing capital
Quantzee is likely the better fit if:
- You have experienced repainting signals on other platforms and need a verified non-repainting alternative
- You want one clear signal per chart with on-chart SL/TP levels rather than managing multiple conflicting indicators
- You trade across multiple asset classes (not just stocks) and want one subscription for all of them
- You are newer to trading and find multi-indicator setups overwhelming rather than clarifying
Practical tips for evaluating any AI trading tool
Before paying for anything — Tickeron, Quantzee, or anything else — run this fast validation sequence:
- Repainting test: Screenshot a signal on a live or Bar Replay chart. Wait for at least five candles to close. Check whether the signal changed. Pass = signal is identical. Fail = tool repaints.
- Edge case test: Apply the indicator to a high-volatility session (a major news day). Check whether signal behaviour is rational or chaotic around the spike.
- Multi-market test: Apply the same settings to two very different instruments. If the signal pattern looks identical on a calm forex pair and a volatile crypto, the adaptive logic is cosmetic.
- Paper trade with fixed rules: Follow every signal for at least one week with a fixed entry/exit protocol. Do not override. You are testing the system, not your judgement.
Conclusion
Tickeron is a legitimate AI analysis platform with real breadth. Its pattern recognition database is a genuine resource, and its on-platform AI Robot performance tracking is more transparent than most signal services. Where it struggles — repainting on some signal types, confidence percentages that require careful interpretation, and the decision fatigue that comes from multiple competing signals — those are structural problems that stem from the platform’s design philosophy of more-is-better.
Quantzee takes the opposite approach: strict non-repainting, one clear primary signal, and on-chart risk levels. For traders who have found AI signal platforms overwhelming or unreliable in live trading, Quantzee’s focused approach is worth evaluating. Add SuperTrend Pro+ and run the repainting test yourself before deciding.
Quantzee indicators are analytical software tools designed to assist your own analysis. This content is for educational purposes only and does not constitute investment advice. Do your own research. Trading involves risk of capital loss. Quantzee is not a registered investment advisor. Analytical software, not investment advice.
Frequently Asked Questions
Explore Quantzee Indicators
- MACD Pro+ — adaptive chop-zone grading + divergence engine
- AI Adaptive Quant Toolkit — AI signal classifier with Level 1–4 confidence grading
View all indicators · See pricing
Related Articles
- 3Commas Alternative
- AI Signals Alternative
- Pine Script Alternative — for traders comparing Tickeron’s AI bots against no-code builders and signal suites