Open any page on candlesticks trading and you get the same thing: a wall of named shapes — hammer, doji, engulfing, marubozu — each with a little icon and a one-line story about what it "means." What you almost never get is a number. Four prices build every candle: open, high, low, close. From those four prices you can compute exactly two ratios. They decide whether a candle is worth looking at before anyone tells you its name. This post is built around those two ratios: body divided by range, and where the close sits inside that range. Both are arithmetic, not vocabulary. Once you can compute them, you'll notice that most of the "patterns" on the cheat-sheet pages are really just these two numbers crossing a threshold.
We're not going to pretend candlesticks trading is a solved science with a guaranteed edge. It isn't, and anyone claiming theirs is a guaranteed win rate is selling something other than analysis. What follows is mechanics: how to measure a candle instead of just naming it, and where that measurement runs out of information.
The Two Numbers a Candle Actually Gives You
Take the four prices for any bar — open (O), high (H), low (L), close (C) — and build two ratios.
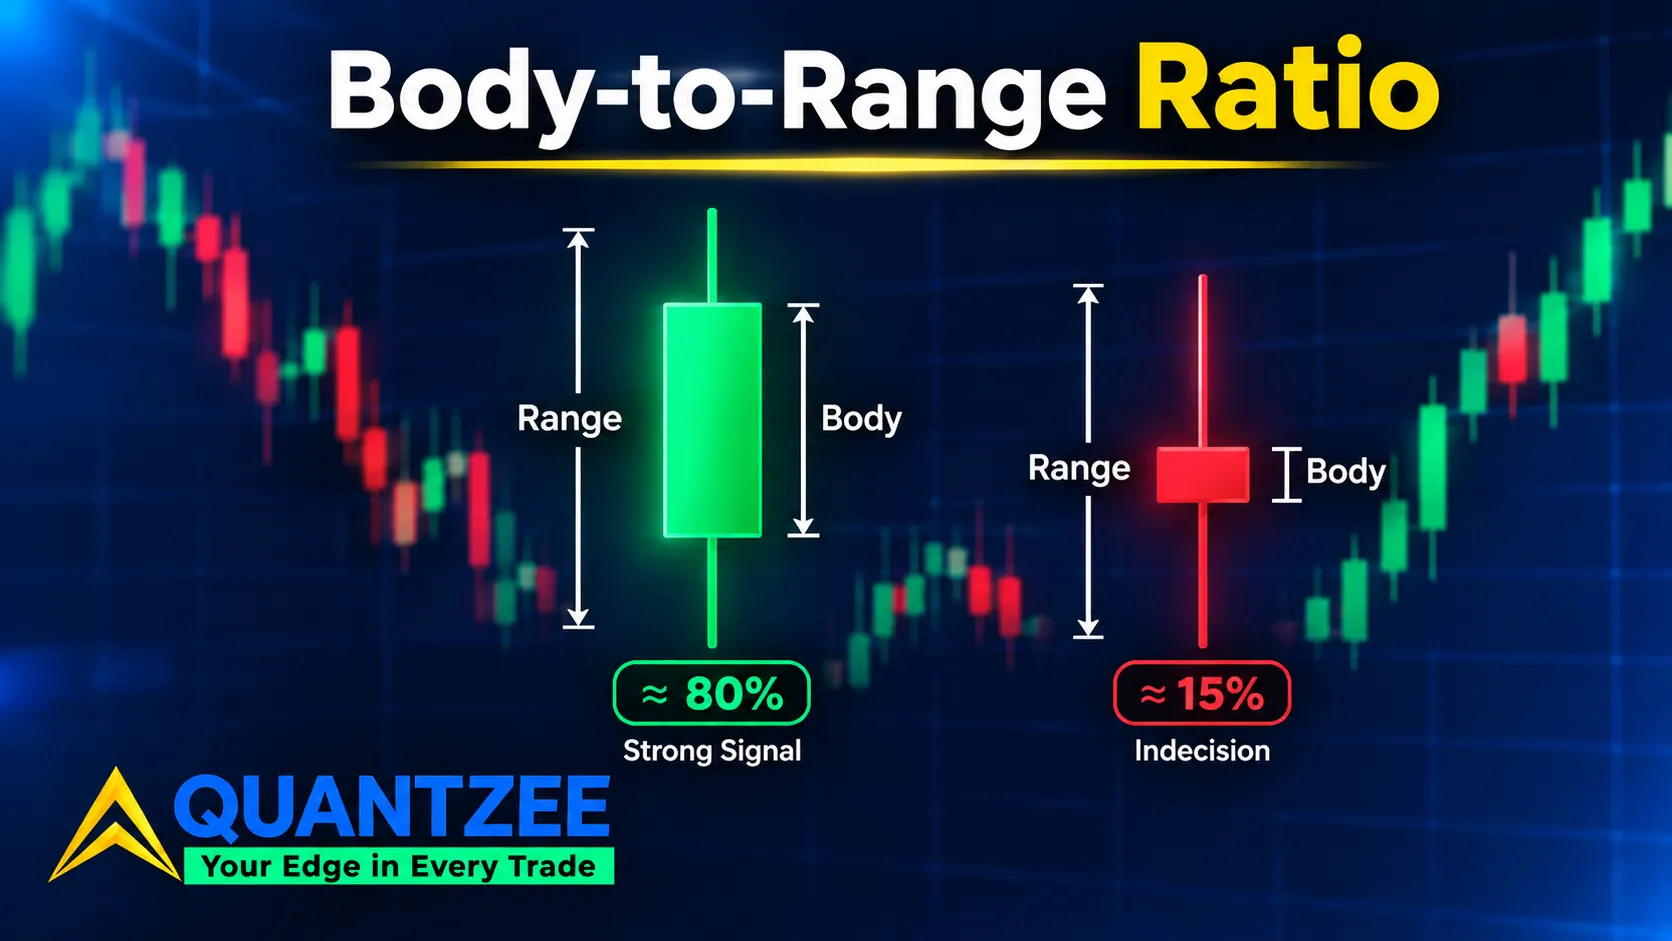
Body-to-range ratio: body = |C − O|, range = H − L, ratio = body / range, expressed as a percentage. A candle that opens at 100, closes at 118, with a high of 120 and a low of 98 has a body of 18 and a range of 22, so body/range = 18 / 22 = 81.8%. That's a decisive candle — most of the session's travel ended up locked in between open and close, with very little wick on either side.
Close-position-in-range: position = (C − L) / (H − L), also as a percentage. Using the same bar, (118 − 98) / (120 − 98) = 20 / 22 = 90.9%. The close landed near the very top of the bar's full range.
Now change one input. Same open and close — 100 to 118 — but the high is 140 and the low is 95. Range is now 45, body is still 18, so body/range drops to 18 / 45 = 40%. Close position: (118 − 95) / (140 − 95) = 23 / 45 = 51%. Same net move, a completely different candle. The first bar is a conviction candle. The second is indecision wearing the same open and close. Anyone reading only "it closed up 18 points" would call both bars bullish. The ratios say otherwise. This is the gap every cheat-sheet page on candlesticks trading leaves unfilled. They'll tell you a long body is bullish. None of them tell you how long is long enough to count.
Checking the Ratio Across Different Instruments
The two ratios are the same formula everywhere, but "decisive" doesn't look the same on every instrument. We maintain scanning panels across equity index futures like the E-mini S&P (ES), a major crypto pair like BTC, and a liquid FX pair like EUR/USD, and the character of the body/range distribution is visibly different across the three. ES sessions tend to cluster body/range readings in a tighter band during the regular trading hours, with wider dispersion around the open and close windows. BTC, trading continuously with no single defined session, produces a noisier spread of readings across a 24-hour window, so a threshold tuned on US trading hours data can misfire outside them. EUR/USD shows its own dispersion shift around the London and New York overlap, when liquidity is deepest and ranges tend to expand.
We're not publishing win-rate numbers from these panels here, for the same reason noted above: a reliability figure needs a stated sample and a stated test, not a glance at a chart. What we can say, because it's a property of the data itself rather than a forecast, is that a single global threshold applied across ES, BTC and EUR/USD without any per-instrument calibration will systematically over-flag on the noisier series and under-flag on the tighter one. If you're running a scanner across more than one instrument, normalize each one against its own recent ATR before comparing body/range readings side by side. Comparing raw ratios across instruments with different volatility character is close to comparing two different units.
This is also why a threshold that looked solid during a quiet month can suddenly flag almost every bar a few weeks later. Volatility regimes shift over periods of days to months, not just between instruments, and a static absolute cutoff has no way to notice. A normalized ratio does, because the ATR term in the denominator moves with the regime instead of staying fixed against it.
What a Threshold Does to Signal Count
A threshold is just a line you draw on the body/range ratio and decide: above this line, the candle counts as decisive; below it, the candle is noise you ignore. To see the effect, look at ten candles pulled together purely to demonstrate the method — not a market sample, just ten bars with a spread of body/range values so the mechanic is visible.
| Bar | Body/range % | Counts at 70% line | Counts at 50% line | Counts at 30% line |
|---|---|---|---|---|
| 1 | 86% | Yes | Yes | Yes |
| 2 | 74% | Yes | Yes | Yes |
| 3 | 61% | No | Yes | Yes |
| 4 | 55% | No | Yes | Yes |
| 5 | 48% | No | No | Yes |
| 6 | 41% | No | No | Yes |
| 7 | 33% | No | No | Yes |
| 8 | 27% | No | No | No |
| 9 | 19% | No | No | No |
| 10 | 12% | No | No | No |
Two bars clear a 70% line. Four clear 50%. Seven clear 30%. That's the whole trade-off in one table. Tighten the threshold and you throw out more candles. That means fewer trades, but a cleaner sample of the ones you keep. Loosen it, and almost every bar with any kind of body "qualifies" — which is close to not having a filter at all. We don't publish a single "correct" threshold here, because the right line depends on the instrument, the timeframe, and what you're using the signal for: entry trigger, confirmation, or exit warning. The point is that a threshold exists and is adjustable, not fixed. The cheat-sheet pages skip this entirely and go straight to naming shapes.
Named Patterns Are Threshold Combinations Wearing Costumes
Once you have both ratios, most of the named patterns in trading candlestick patterns collapse into threshold rules:
- Marubozu — body/range above roughly 90%, meaning almost no wick on either end. It's the purest "decisive" reading on the scale.
- Doji — body/range below roughly 5-10%, open and close essentially equal. Our separate breakdown of the doji candlestick pattern goes through the three situations where that near-zero body means very different things depending on what came before it.
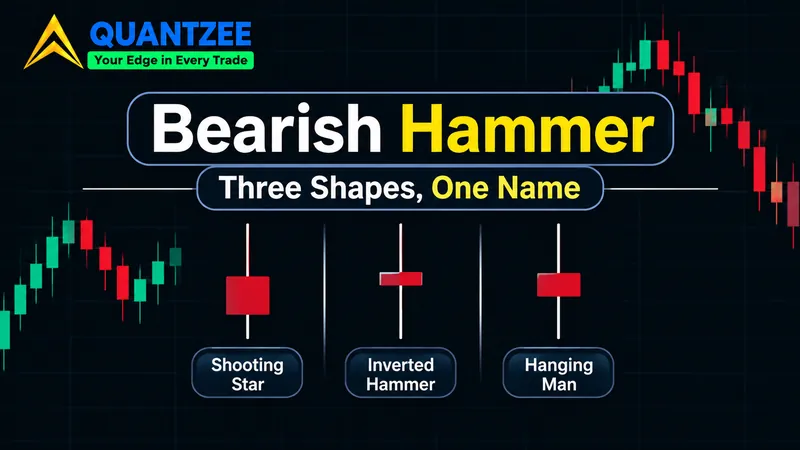
- Hammer / hanging man — a small body (low body/range, typically under 30%) combined with close position above roughly 65-70%, and a lower wick that's at least twice the body. The shape test and the ratio test agree here, which is part of why this pattern reads consistently across sources.
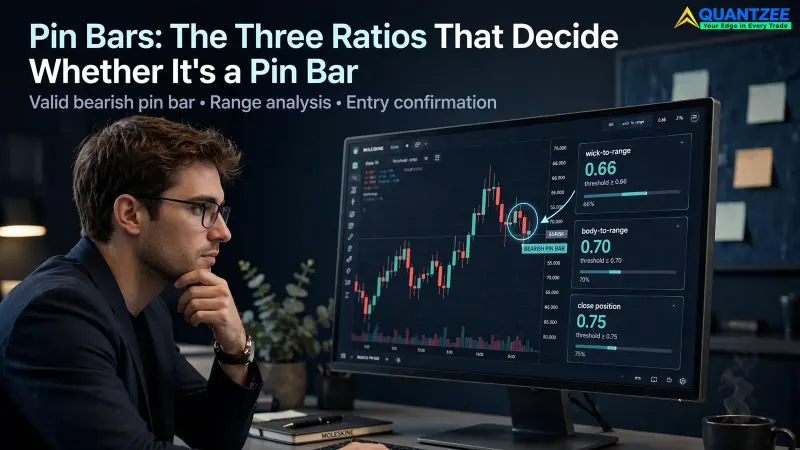
- Pin bar — a small body with close position pushed to one extreme of the range. We go deeper on exactly which three ratios define a usable pin bar in a dedicated piece, because a sloppy pin-bar definition is one of the more common ways stock trading candlestick patterns get misapplied.
- Engulfing candle — not a single-bar ratio at all, but a two-bar relationship: the second body fully contains the first body's open-close range. Our engulfing candle piece covers why the same engulf means something different depending on where it sits in the recent range.
Every one of these is a rule you can code as an if-statement on two numbers. The named vocabulary is useful shorthand for talking about charts out loud, but it isn't the primitive — the ratios are.
Why the Ratio Is Scale-Free but the Range Isn't
Body-to-range is a ratio, so a 60% reading means the same geometric thing whether the bar is one point tall or a hundred points tall. That's useful, but it hides a problem: the range itself isn't scale-free, and a 60% body on a quiet session and a 60% body on a high-volatility session are not equivalent trades. A five-point range on a day where the instrument typically moves two points is enormous. The same five-point range on a day where it typically moves twenty points is nothing.
That means a threshold can't travel from one instrument to another, or from one volatility regime to another on the same instrument, without adjustment. The range needs to be normalized against a volatility measure first, commonly an average true range over the recent N bars. A body/range of 70% on a bar whose range is three times the 20-bar ATR is a very different signal from the same 70% on a bar whose range is half the ATR. Skipping this step is the single most common way a threshold that worked on one chart quietly stops working on another. The ratio held steady, but what counted as "big" moved underneath it.
What the Ratios Can't Do Alone
Two numbers from one bar will never be a complete trading signal, and treating them as one is the fastest way to turn a filter into a false sense of precision. Two things have to be layered on top before a decisive candle becomes an actionable one.
First, location relative to prior structure. A marubozu at a fresh breakout level reads completely differently from the same marubozu in the middle of a range that's been chopping for two weeks. The ratio tells you the bar was decisive. It says nothing about whether "decisive" happened somewhere that matters.
Second, what the next bar does. A single bar, however clean its ratios, is a proposal, not a confirmation. Most disciplined use of candlestick signals waits for the following bar to either extend the move or fail to — that's the actual trigger, with the ratio bar serving as the setup. Our glossary entry on OHLC data covers how these four prices get recorded differently across venues and timeframes, which matters once you're layering a second bar's confirmation on top of the first bar's ratio.
There's a third layer worth naming separately: time of day. The same body/range reading forming in the first few minutes after a session opens carries different weight than the identical reading forming an hour before the close, because the processes generating price are different at each point in the session — thin early liquidity finding a level versus end-of-day positioning closing it out. A scanner that treats a 9:35 candle and a 3:50 candle as interchangeable just because their ratios match is throwing away information that was free to use.
What Candlesticks Genuinely Cannot Show You
This is mechanics, not philosophy, and it's worth stating plainly because it's the part most candlesticks trading guides skip in favor of reassurance. A single OHLC bar cannot show you:
- The path inside the bar. A bar with a wide range and a small body could have gone straight up, straight down, or bounced between the high and low six times before settling near the open. The four prices compress all of that into one shape.
- The order of the high and the low. Standard OHLC data doesn't record whether the high or the low printed first within the bar's time window. That ordering can matter a great deal for intraday timing and is simply not recoverable from the bar alone — you'd need tick or lower-timeframe data to reconstruct it.
- How much volume sat at each price. The close might be near the top of the range on light volume at that level, or it might be near the top of the range because heavy volume genuinely transacted there. A plain candlestick carries total volume for the bar at best, not where inside the range that volume concentrated.
None of this makes the ratios useless — it just means they're a compressed summary of the session, not a replay of it. Treat them as a fast first filter, not a complete picture. If you need the path inside the bar, step down to a lower timeframe and look at the sequence of smaller candles that make up the larger one; if you need where volume concentrated, a volume profile overlay fills that gap, not the candle itself.
Coding the Filter and the Three Mistakes People Make
As a single condition, the filter is short:
body_range = abs(close - open) / (high - low)
close_pos = (close - low) / (high - low)
is_decisive = body_range >= 0.70 and close_pos >= 0.65
We've built and rebuilt versions of this exact filter inside the Quantzee toolkit, and the three mistakes below are the ones we've found break it every time, in order of how often we've seen them:
- Dividing by body instead of range. This inverts the ratio — a huge-range, small-body indecisive candle ends up scoring as "more decisive" than a tight-range, full-body one, which is backwards. The denominator has to be the full high-low range, every time.
- Using absolute point values instead of a normalized ratio. A rule like "body bigger than 5 points" breaks the moment the instrument's typical range changes — during a quiet month, during a volatile month, or when you move the same code to a different instrument. The ratio travels; the raw point count doesn't.
- Applying a daily-chart threshold to a five-minute chart. Candle anatomy behaves differently across timeframes because the processes generating the four prices are different — intraday bars are shaped heavily by session open/close mechanics and liquidity windows that don't exist on a daily bar. A 70% threshold calibrated on daily closes will flag a very different, and usually much larger, share of five-minute bars than it does on the daily chart it was built for.
Each of these is a one-line bug that produces a filter that still runs, still returns results, and quietly means something other than what you think it means. We've seen versions of all three ship inside working strategy code that passed a casual review, because a filter that's wrong in one of these three ways still produces output that looks plausible on a chart. The only real check is to log the body/range and close-position values the filter is computing, sort a sample of 50 to 100 bars by those values, and eyeball whether high-ranked bars actually look decisive and low-ranked bars actually look indecisive. If that sanity check fails, one of the three mistakes above is almost always the cause.
How We Approached This
This piece is a mechanics explainer, not a backtested reliability study, and we want to be direct about that distinction rather than let a table of numbers imply otherwise. The ten-bar threshold table above is a hand-built teaching set used to show how a sliding threshold changes signal count — it is not drawn from live market data, and we've labeled it that way rather than attach a false precision to it. Historical "reliability" percentages that circulate for candlestick patterns are frequently unsourced round numbers, or numbers measured on one market and quietly reused for another. According to the NBER working paper by Lo, Mamaysky and Wang on the statistical properties of technical patterns, formal pattern-recognition studies require a defined algorithm, a stated sample and explicit statistical testing before any reliability claim means anything — exactly the discipline that's missing from most candlestick round-ups. If we publish a dataset study measuring these ratios across real instruments, it will state the instruments, the bar size, the date range and the sample count, per the same standard. Until then, treat this article as the arithmetic and the filter logic, not a performance claim.
Our team builds scanning tools for a living, and in our experience the candles that cause the most damage to a trading plan aren't the exotic patterns — they're the ordinary, indecisive bars that get mistaken for conviction because they happen to close green or red. We've run versions of this exact body/range and close-position filter inside internal scanning tools for more than 18 months, across several revisions, and the version that survived is the one described in the code block above. When we design a filter for the Quantzee toolkit, that pair of ratios is usually the first gate, before any pattern name ever enters the logic.
One more practical note from that process: the two ratios are cheap to compute, so there's rarely a reason to compute only one of them. A scanner that filters on body/range alone, without also checking close position, will still pass through bars where the body sits oddly centered in the range — not a clean top-of-range or bottom-of-range close, just a body floating in the middle of a long wick on both sides. That shape doesn't match the clean "conviction" story the body/range number alone seems to tell, and close position is what catches it.
Where This Fits With the Full Pattern List
If you want the fuller catalogue of named shapes ranked by how consistently they show up across data, our candlestick patterns cheat sheet covers that ground — this piece is meant to sit underneath it, as the two numbers you should be computing before you ever open that list and go looking for a name. A regulatory education source worth bookmarking alongside both is investor.gov, the SEC's own investor-education site, which is consistently blunt about one thing: any charting tool, candlesticks included, describes the past, not a promise about what happens next.
Frequently Asked Questions
This article is a historical and mechanical measurement explainer on a fixed, stated sample where noted. Quantzee provides analytical software, not investment advice, and nothing here is a recommendation to buy or sell any instrument. Paper trade any filter before risking live capital.