Search for the bearish hammer candlestick and you will not find one pattern. You will find at least three, filed under the same name, drawn differently, and pointing at different candles on your chart. One page says it's the inverted hammer. Another says it's the hanging man. A third describes a shape that is neither. If you mark charts from any single one of them, you'll mark a candle the other two would reject.
This post doesn't add a fourth definition. It sorts the three shapes the phrase is actually used for, names the classical pattern each one is, and gives you the one test that decides the read in every case. We also say plainly what we haven't done: no first-party scan of these shapes exists at Quantzee, so you won't find a win rate here. That absence is deliberate, and the reasons are further down.
What the phrase "bearish hammer" is being used for
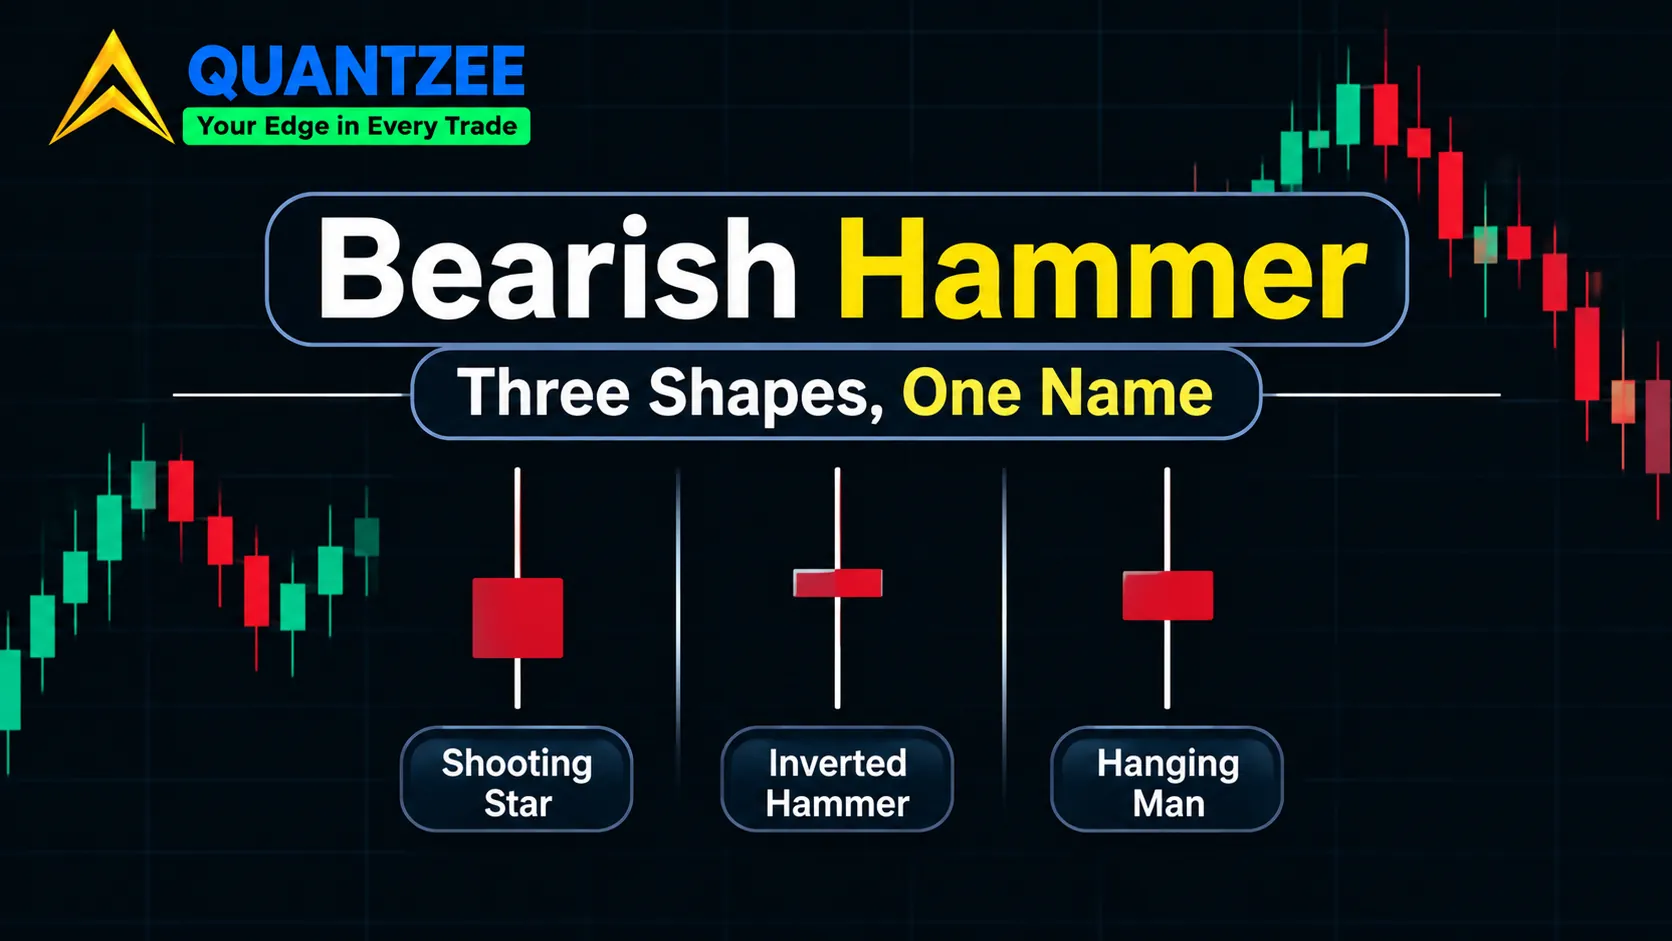
Strip the label off and the phrase gets applied to three different candles.
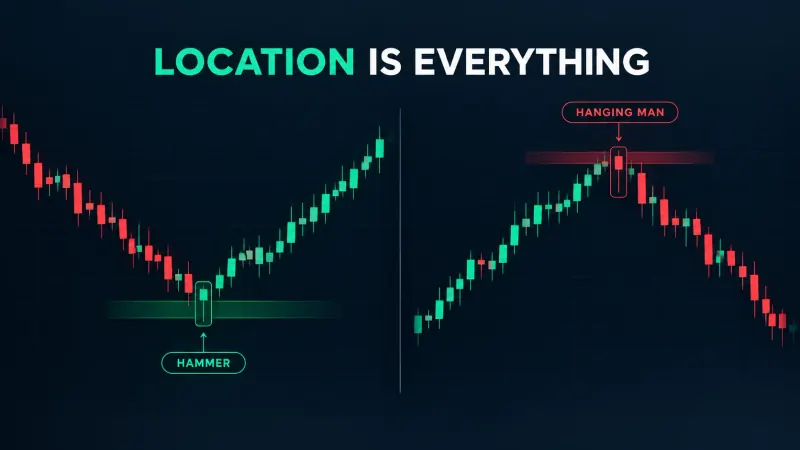
Shape one: long lower shadow, small body at the top of the range. After an advance this is the hanging man. After a decline it's the hammer. Same candle, opposite meaning, and the trend before it is the only thing that tells them apart.
Shape two: long upper shadow, small body at the bottom of the range. After an advance this is the shooting star, which is bearish. After a decline it's the inverted hammer, which is a bullish-reversal candidate. Again the geometry is identical and the location flips the name.
Shape three: a hammer-shaped candle with a red body. People call this a bearish hammer because red feels bearish. But red is a colour, not a pattern. It tells you the close finished below the open, and in a candle where the body is the smallest part of the range, that's the least informative thing about it.
Two shapes, one colour rule, and a trend condition that reverses the meaning of the first two. That's the whole problem, and the rest is working out which of these a given page means.
Where the ranking pages disagree, quoted
This post makes a claim that's easy to dismiss if it's only asserted, so here are the quotes. Our team read the live pages on 2026-11-05 and copied the wording as it stood that day. Pages change, so check the dates yourself.
The Dukascopy hammer candlestick article says: "The inverted hammer (bearish hammer candlestick) is the opposite of the hammer pattern. It appears at the top of an uptrend and suggests a potential reversal downwards." In classical candlestick work the inverted hammer is the long-upper-shadow shape that follows a decline and leans bullish. Placing it at the top of an uptrend with a bearish read turns it into something else, and the shooting star is the name that fits.
The GoCharting documentation page is titled "Bearish Hammer (Hanging Man)" and then opens with "A Bearish Hammer (Inverted Hammer) is a candlestick pattern that indicates potential trend reversal from a bullish to a bearish direction." Its shape description reads "a small real body (can be red or green) at the lower end of the trading range, with a long upper shadow." That is a long upper shadow with the body at the bottom, which is the shooting star geometry, while the page title names the hanging man, whose shadow points the other way.
So in a sample of two ranking pages, we found that one equates the bearish hammer with the inverted hammer, and the other uses the title of one pattern, the parenthetical of a second, and the shape of a third. Neither is lying to you on purpose. Each page copied a loose convention and never checked it against the others.
A third page we read, TrendSpider's learning-center article on the hammer, has a cleaner taxonomy: hammer, inverted hammer, hanging man, each tied to its trend context. It never uses the phrase "bearish hammer" at all. Three pages, three answers, one of them silence.
The three shapes as rules, not pictures
Pictures hide the ambiguity because your eye fills in the trend. Rules don't. Here is each shape as something you could code.
Rule A: body at the top, long lower shadow
The body sits in the upper part of the candle's range. The upper shadow is negligible. The lower shadow is at least twice the body. Our hanging man page on why location does all the work puts the upper shadow at under roughly 10% of the total range, and the lower shadow at two times the body or more. If an advance came first, call it a hanging man. If a decline came first, call it a hammer.
Rule B: body at the bottom, long upper shadow
This is the mirror image: a small body in the lower part of the range, a negligible lower shadow, and an upper shadow at least twice the body. After an advance it's a shooting star, and after a decline it's an inverted hammer.
Rule C: shape A with a red body
There's nothing new here, because it's rule A and the body colour doesn't move it into another family. TrendSpider's article says colour isn't critical to the read, though a green body is slightly more bullish. We agree with that framing and would go further: when the body is a tenth of the candle, the open-close relationship inside it is the weakest signal on the bar.
Notice what's missing from all three. None of them mentions the word bearish. The direction comes from the trend condition, and that condition lives outside the candle. A shape-only scanner can find rules A and B. It cannot tell you which side of the table you're on.
Why colour is the weakest of the three distinctions
A candle has a high, a low, an open and a close. The shadows span from the body to the extremes, and in every shape above the shadow is the story: price went somewhere, and got pushed back. The body only records where the close ended relative to the open, inside a small slice of the range.
Take a hammer shape where the lower shadow is 6 points and the body is 1 point. Whether that 1-point body is red or green changes the read by a sliver. Whether the 6-point shadow came after a 12-bar decline or a 12-bar advance changes the read completely. When we compared how the three pages use colour, GoCharting is the only one that mentions it explicitly ("can be red or green"), and even there it's offered as a footnote, which tells you what its authors think of it.
If a source tells you a red-bodied hammer is bearish and a green-bodied one is bullish, it is using colour as a shortcut for a decision it hasn't made about location. Treat that as a flag.
Location does the work, not the shape
The same candle is a hammer after a decline and a hanging man after an advance. We argued this at length in our own hanging man piece, so we'll summarise rather than repeat it: the trend into the candle assigns the label, and the next bar decides whether the label holds.
The practical consequence is blunt. A tool or a screener that flags "hammers" by shape alone is giving you half a classification. It's telling you the geometry matched. It's silent on direction. The shooting star and the inverted hammer have the same problem on the upper-shadow side.
That same page gives a numeric test for what counts as an advance, and it's worth reusing because "trending up" is the vaguest phrase in technical analysis. Look at the 10 bars before the candle. If at least 6 of them make higher highs and higher lows, you're in an advance. The move should also cover at least 1.5 times the average true range of the preceding 14 bars and run at least 5 bars. A two-bar pop doesn't qualify. The mirror conditions define a decline.
These thresholds are the published choices of one page, not laws of the market. We reproduce them because they turn "after an advance" from an opinion into a check you can run the same way on Monday and Friday.
The measurable criteria nobody publishes
Suppose you want to mark any of these shapes consistently, or build a rule to do it. Three choices have to be made, and in the pages we read, none states a number for all three.
- Shadow-to-body ratio. How long must the dominant shadow be relative to the body? Two times is the most common threshold. TrendSpider says the lower shadow is "often twice the body or more." That's a tendency, not a cut-off.
- Body position inside the range. Does "at the top" mean the body's top touches the high, or that the whole body sits in the upper third? Two readers will disagree on a candle that sits in between.
- Maximum opposite shadow. How much shadow on the wrong side is allowed before the candle stops qualifying? Our pages use under roughly 10% of the range. Others say "little or none," which a scanner can't execute.
Pick different values for those three and you get different candles, and different candle counts. That's not a small detail. A rule set that accepts a 1.5 times ratio will flag many more shapes than one demanding 2.5 times, and none of the extra ones are wrong by the page's own definition.
One candle is half a signal
Even a correctly named candle in the right location is only a warning. The confirmation requirement is the second half, and we set it out in our hammer confirmation guide on what the next two bars do: the bar after the candle has to close beyond the body high on a close basis, not an intrabar touch, before the read stands.
Flip that for the bearish side. A hanging man or shooting star isn't confirmed until the following bar closes back below the body low. The mirror logic applies to invalidation, too. If the next bar closes above the high of the warning candle, the warning has been overridden.
One honest caveat. The confirmation rule on that page comes with its own sample statistics. We are not reusing them here, because they measure a hammer, not any of the contested shapes in this post, and carrying a number across a naming problem is precisely the mistake we're criticising.
Why published reliability figures can't be compared
Reliability numbers for hammer-family patterns do exist. The ATAS article on the hammer cites Bulkowski and a CandleScanner study that ran over 1995 to 2015. We haven't re-run either, and we are not quoting percentages from them.
The reason is the naming problem compounding. Source X measures a hanging man after a defined uptrend. Source Y measures any long-lower-shadow candle with a red body. Source Z uses "bearish hammer" for an upper-shadow shape. Each counted a different set of candles and each reports a number under a name that can be read as the others. Put those numbers in one table and you get a ranking of definitions, not of patterns.
Before you rely on any reliability figure for a candle, ask three things. Which exact shape was counted? What trend condition was required, and how was it measured? What was the confirmation rule, if any? A source that can't answer all three hasn't told you a number you can use.
If you want a neutral definition of the discipline itself, the SEC's investor education site, Investor.gov, keeps a glossary entry on technical analysis. Read it as background on the method, not as evidence for any one candle. The evidence base for a single named candle is thinner than most pattern pages suggest, and that gap is exactly why the naming problem matters.
There is also a quieter cost. Say you save a "bearish hammer" alert on a charting platform. The platform's author picked one of the three shapes when they wrote the rule, and the label on the alert doesn't tell you which. Two traders can run the same named alert and be looking at different candles, then compare results as if they'd tested the same thing. Before you trust any alert or scanner with this name, open its definition and read the shadow rule, the body position and the trend condition it uses. If the documentation doesn't state them, you're trusting a label.
A marking checklist you can apply in order
When a candle catches your eye, run these four steps in sequence. The order matters because each step removes an ambiguity the previous one couldn't.
- Identify the shape by rule, not by name. Where does the body sit in the range, and which shadow is long? Ignore the colour at this stage.
- Check the prior trend numerically. Use the 10-bar swing count, the 1.5 times ATR move and the 5-bar duration, or your own stated thresholds. Write them down once and keep them fixed.
- Apply the ratio test. Dominant shadow at least twice the body, opposite shadow under roughly 10% of the range. If it fails, it's not one of these candles, whatever a page calls it.
- Wait for confirmation. Don't act on the warning candle's own close. The next bar's close decides whether the read stands.
Steps one to three are mechanical and tedious to repeat by eye across many charts, which is the kind of job a rules-based tool does well. If you want the rules held for you while you watch the chart, the Adaptive AI Oscillation Engine is built as that kind of analytical layer. It surfaces conditions. It doesn't place trades or manage risk, and nothing in it is advice. Paper trade any rule set first, on your own instrument and timeframe, before you put capital behind it.
Related reading on the same family of problems: the three ratios that decide whether it's a pin bar covers the same shadow-to-body arithmetic from another angle, and the doji candlestick page on its three situations shows the same location-over-shape logic on a symmetrical candle.
How we put this together
The methodology is simple and small. We read a sample of three ranking pages in full on 2026-11-05, copied the exact wording where we quote, and compared each page's description to the classical definitions of the hammer, inverted hammer, hanging man and shooting star. The ratio thresholds and the confirmation rule come from our own two live pages, reproduced as published there with their caveats. We did not scan charts for these shapes, and we have no win rate for any of them. If that changes, we'll publish the scan with its rules and its sample size.
The StockCharts and TradingView candlestick references were on our reading list, but their pages did not load for us on the day, so we haven't cited them for anything. Where a classical definition appears above, treat it as the common textbook convention and check it against whichever reference you trust.