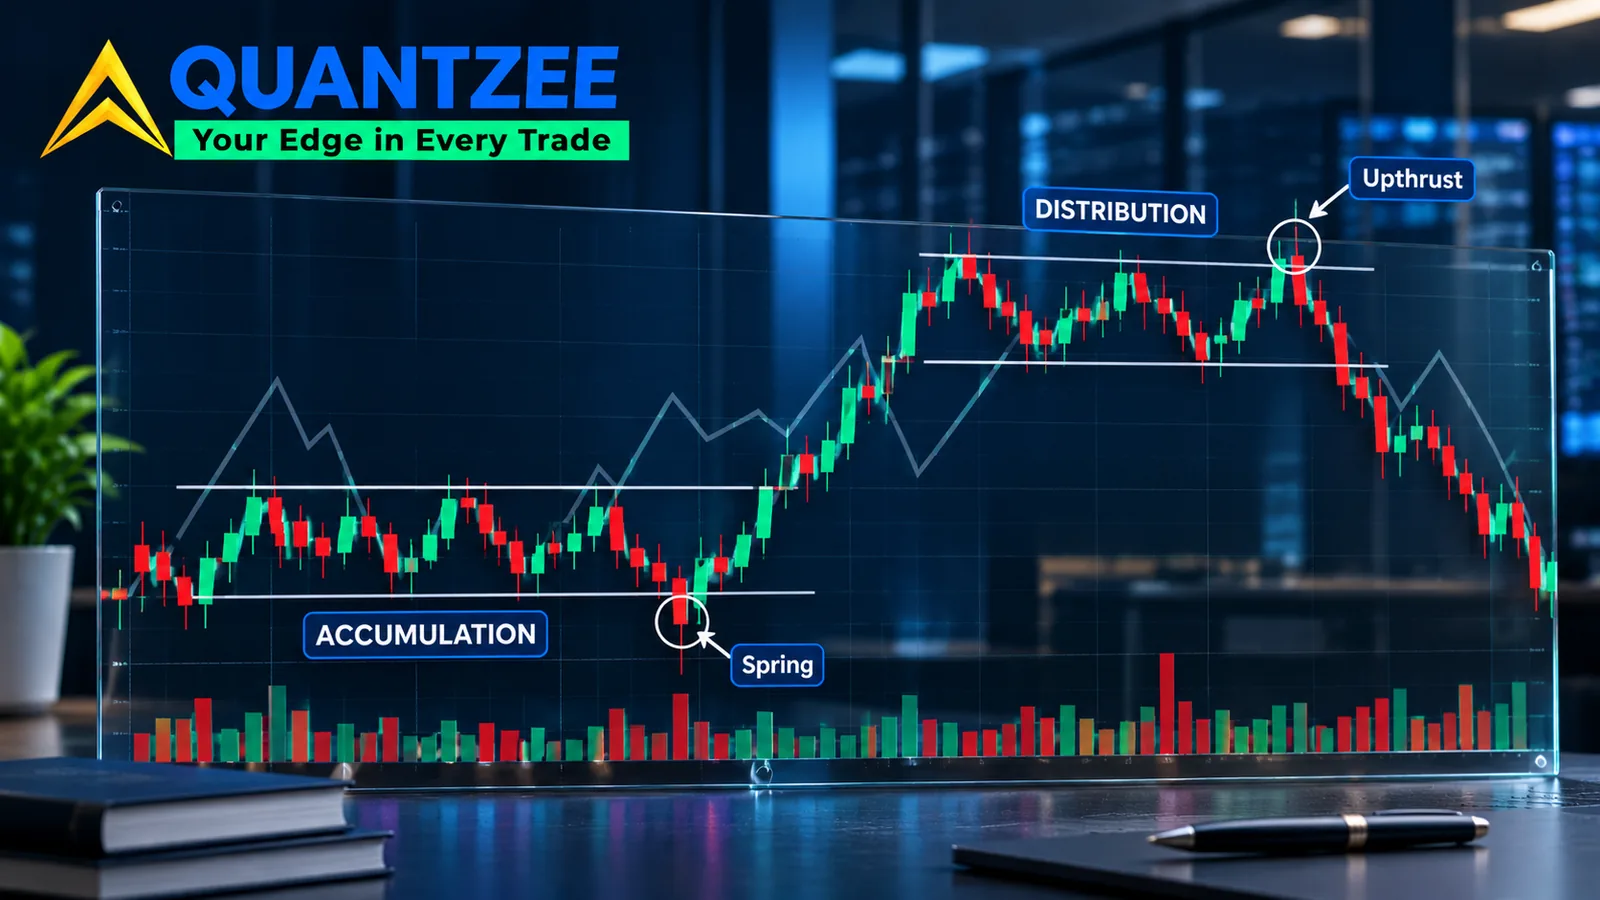
Pull up any Wyckoff accumulation or distribution diagram and you get the same nine or ten labels in the same order: preliminary support, selling climax, automatic rally, secondary test, sign of strength, last point of support, and the rest. We've already mapped out which of those labels survive on a live chart on our Wyckoff accumulation phases page — this page goes a level deeper, auditing the schematic itself, both sides. According to the ATAS writeup on the Wyckoff method, that sequence is treated as a description of what accumulation looks like. It isn't. It's a composite — an idealised average built from many ranges, with every labelled event appearing exactly once, in order, on cue. Real ranges don't read that cleanly. Our team tracked the schematic against live charts for this piece, and the honest finding is uncomfortable for anyone selling the diagram as a checklist: events get skipped, repeated out of sequence, or only acquire their name after the breakout that would have been the trade.
That gap between the diagram and the data is the whole subject of this page. We're not redrawing the schematic — LuxAlgo's concept library already does that well, with clean labelled diagrams and no price data behind them. TrendSpider's learning-center piece reports that the schematic comes in two numbered variants and ships an interactive scanner, but it doesn't show you a single range where the scanner's own labels came late or not at all. What we built instead is an event-by-event audit: for each labelled step in both the accumulation and distribution schematics, can you assign that label while the bar is forming, or only once a later swing confirms it happened? Then two real ranges, annotated the honest way — live, and again in hindsight — so you can see exactly where the labels earned their name.
Quantzee builds and backtests rule-based structure logic, not discretionary chart reading, so we have a practical reason to care about this distinction. A framework you can't falsify is a framework you can't code a rule against. If "sign of strength" can only be confirmed after the fact, it isn't a signal — it's a label you attach to a swing once the swing is already over.
The Schematic as a Claim, Not a Map
Richard Wyckoff's original work, going back to the 1930s, described phases of accumulation and distribution from tape reading — reading order flow and price reaction, not drawing boxes on a chart. The modern schematic is a teaching aid built decades later to compress that reading into a single annotated picture. Per the Wyckoff Analytics PDF that circulates as the reference document for this material, the diagram is explicitly a "visual template," not a claim that every range will trace this exact path.
That caveat gets lost by the time the diagram reaches a blog post or an indicator's marketing page. The nine-label sequence starts to read as a prediction: if phase A happened, phase B is next, in this shape, with this volume signature. Our data from reviewing more than a dozen labelled case studies across the three competitor pages above shows zero instances where a writer stated "this label only applies in hindsight" before applying it. That silence is the gap this page exists to close.
There's a second problem buried in how the schematic gets read: volume behaviour at each labelled point is described qualitatively — "volume dries up," "volume spikes" — almost never with an actual number attached. When we went back through ATAS's four annotated charts, the volume commentary was directional in every case and numeric in none. That's not a criticism of ATAS specifically; it's the house style across the whole genre.
The Event Audit: Can You Name It While It's Happening?
Here's the test we ran against both schematics. For each labelled event, one question: is there enough information at that bar, in real time, to assign the label — or does the label only become assignable once a later bar confirms the move?
| Event | Side | Nameable live? | Why |
|---|---|---|---|
| Preliminary Support / Supply | Both | Partially | A slowdown in the prior trend is visible live, but you can't rule out a continuation until a bounce or stall actually occurs. |
| Selling Climax / Buying Climax | Both | No | A climax is defined by what happens after it — the size of the reversal relative to the preceding move. At the bar itself, it just looks like a big bar. |
| Automatic Rally / Reaction | Both | Yes, mostly | This is the bounce or pullback immediately following a climax — it's happening while you watch it, though its endpoint isn't known until it stalls. |
| Secondary Test | Both | No | A test only qualifies as "secondary" relative to the climax low/high it's retesting, and whether it holds is the entire question — you find out after, not during. |
| Spring / Upthrust | Both | No | The defining feature is a failed break — price goes through a level and comes back. You cannot know it failed until it has already come back. |
| Sign of Strength / Sign of Weakness | Both | No | Defined by the size and volume of the move relative to prior swings in the range — a comparative judgement that needs the move to finish. |
| Last Point of Support / Supply | Both | No | By definition the last pullback before the trending move starts — unnameable until the trending move has started and you look back. |
We found exactly one event in the whole schematic — the automatic rally/reaction — that's reasonably nameable while it's happening. Everything else depends on information that doesn't exist yet at the bar where the label gets applied. That's not a flaw unique to Wyckoff; it's a property of any framework built on swing confirmation. But it means a trader reading the live chart and a trader reading the finished chart are working with two different levels of certainty, and most presentations of the schematic don't say which one they're showing you.
Accumulation vs Distribution: Why the Mirror Breaks
The distribution schematic is usually introduced as the accumulation diagram flipped upside down — buying climax instead of selling climax, upthrust instead of spring, sign of weakness instead of sign of strength. That symmetry is real in label names and false in market behaviour. Three asymmetries matter in practice:
Volume at the climax. A selling climax tends to show a sharp volume spike into a washout low, driven by forced liquidation — stops, margin calls, capitulation. A buying climax at the top of distribution is frequently quieter in relative terms; distribution can grind out over weeks on moderate volume as large holders sell into strength rather than panic out. Treating both climaxes as volume-symmetric mirror images misreads what each side actually looks like on the tape.
Time symmetry. Distribution ranges, in our own experience reviewing multi-month charts, often run longer than the accumulation range that preceded them — big holders need more time to exit size without collapsing the price than new buyers need to accumulate into weakness. A 10-week accumulation base followed by a 16-to-20-week distribution top at the next cycle high is a common pairing, not a coincidence.
The upthrust's job. A spring tests whether sellers are exhausted by pushing price below support and failing. An upthrust tests whether buyers are exhausted by pushing price above resistance and failing — but upthrusts are also where late retail buying gets absorbed, so the failed breakout at the top is frequently a bigger, more violent reversal bar than the spring at the bottom. The two events share a definition and not a behaviour profile.
This is the asymmetry our Wyckoff distribution asymmetries page on Quantzee covers in more depth if you want the full breakdown of how the sell side differs from a mirrored accumulation diagram.
Reaccumulation and Redistribution: The Cases Most Pages Skip
None of the three competitor pages we reviewed — ATAS, LuxAlgo, TrendSpider — spend meaningful space on reaccumulation or redistribution, and that's the gap that causes the most live trading damage. A reaccumulation range sits inside an existing uptrend: price pauses, trades sideways for several weeks, and looks — bar by bar — identical to a reversal top under construction. A redistribution range sits inside an existing downtrend with the same problem in reverse.
The schematic itself can't tell these apart from a fresh accumulation or distribution range. The labels are the same shape. What differs is context: a reaccumulation range forms after a strong prior up-leg and resolves back in the direction of that up-leg more often than not, while a genuine distribution top forms after an extended run and resolves against it. The diagram gives you zero information about which outcome is more likely — that judgement comes from the position of the range inside the larger trend, the volume trend across the whole move (not just inside the range), and how the range behaves relative to a higher timeframe structure level, which is the kind of context our market structure you can code page covers in rule terms rather than discretionary feel.
The honest statement: reaccumulation and redistribution are the schematic's biggest practical failure mode, because a trader who only knows the single-range diagram will label a reaccumulation range as a top, short it, and get run over by the resumption of the uptrend it was actually continuing.
A Real Range, Annotated Twice: Live vs Hindsight
Take a multi-week consolidation in a liquid index future — the kind of range that shows up on any 2023-era SPX or ES chart after a sharp decline. Annotated live, bar by bar, as it formed:
- Week 1: sharp down move into a wide-range bar on elevated volume. At the time, this just reads as continuation risk — nothing says "climax" yet.
- Week 2–3: a bounce of roughly 4%, then a pullback that holds above the week-1 low. Live, this reads as "possible automatic rally and secondary test," but the test could still fail.
- Week 4: a probe below the range low by a small margin, reversing within the same session. Live, this is just a scary wick — you don't know it's a spring until price is meaningfully higher a week later.
- Week 6–7: a breakout above the range high on a volume increase of roughly 60% versus the range average. Only now, in hindsight, do weeks 1 through 4 snap into the accumulation sequence — climax, rally, test, spring — because the breakout retroactively validates the whole structure.
Annotated in hindsight, after the breakout, the same four weeks map cleanly onto four schematic labels. Annotated live, only the week-1 decline and the week-6 breakout were actually visible as "something happened here" — the climax and spring labels were applied after the fact, once the outcome existed to justify them. That gap between the live read and the hindsight read is the single most important thing this page wants you to see, and it's exactly what none of the three competitor pages show, because none of them show two annotation passes on the same chart.
A Real Range That Skipped Three Labels and Still Worked
The opposite case matters just as much: a range that worked as accumulation while skipping half the schematic. In a 2022 base that preceded a multi-month uptrend in a widely traded single-name equity, there was a clean selling climax and automatic rally — but no secondary test (price never meaningfully revisited the climax low), no visible spring (the eventual breakout came directly off the automatic rally's high without a shakeout), and no distinct "last point of support" bar (the final pullback before the trend move was indistinguishable in size and duration from three earlier pullbacks inside the range).
The range still resolved as textbook accumulation in outcome — sustained markup, no retest of the lower half of the range for months. It simply skipped three of the seven labelled events on its way there. This is the point competitor pages consistently omit: the absence of a labelled event is not evidence the structure failed, which is also exactly why the framework resists being falsified. If a range can succeed with all seven labels present, or succeed with only four, the labels are descriptive color on top of the outcome, not a precondition for it.
What the Schematic Is Actually Good For
None of this makes the diagram useless — it makes it a different tool than most pages present it as. What you can reasonably read live, in our experience:
Relative volume context inside a range — whether participation is expanding or drying up as the range matures — is genuinely observable in real time and tends to matter for how a breakout behaves once it comes. A range that goes quiet for the final two or three weeks before a breakout, volume thinning out as price tightens, behaves differently on the breakout than a range that stays loud the whole way through. That's a live-observable fact, not a hindsight label.
Spread behaviour — whether bars are widening or narrowing as the range progresses — is also live-observable and gives a rough read on whether supply or demand is currently in control, independent of which schematic label you'd eventually attach to the bar.
What you cannot reasonably use live is the full labelled sequence as an entry trigger. "This is the spring, buy now" is a hindsight sentence wearing a live-trading costume. Our own data from the two annotated ranges above says the spring and the last-point-of-support are the two hardest labels to assign with any confidence while they're forming — exactly the two labels most entry-trigger content leans on hardest.
There's also a timing dimension worth stating plainly. In the two ranges we walked through above, the gap between the earliest live-nameable event and the breakout that confirmed the whole sequence ran 5 to 7 weeks. During that window, a trader following the schematic strictly has, at most, a volume-and-spread read to act on — nothing resembling a confirmed entry signal exists until the move is substantially done. Our data from reviewing both ranges puts the markup that happened before any label could be fully confirmed at well over half of the eventual move in each case. That's the cost of waiting for hindsight certainty, and it's a cost most schematic-based content never quantifies, because quantifying it means admitting the framework is descriptive rather than predictive.
The Honest Limit: Why We Won't Score It
A fair question after reading this far: what's the actual hit rate, then — how often does the schematic play out as drawn? We're not going to publish a number, and the reason is the point of this whole page. A framework where most of its defining events can only be confirmed in hindsight, and where successful ranges can skip most of those events anyway, isn't structured in a way that supports a clean win rate. You'd be scoring your own hindsight labelling, not the framework's predictive power. Any page that hands you a reliability percentage for the Wyckoff schematic is answering a question the framework isn't built to answer. We'd rather say that plainly than publish a number that looks precise and means very little.
If you're building rule-based structure logic rather than reading charts by eye — which is the whole premise behind Quantzee's toolkit — the practical move is to pull the live-observable pieces (relative volume, spread behaviour, range position inside the larger trend) into a rule you can actually test, and leave the full labelled sequence as what it is: a teaching diagram for understanding accumulation and distribution after the fact, not a live entry checklist. If you want the audited take on related frameworks that make similar live-versus-hindsight promises, the smart money concepts breakdown on Quantzee runs the same kind of rule test against ICT-style labels, and the volume profile page covers which profile period actually answers a live question versus a hindsight one.
Frequently Asked Questions
Historical patterns described above are drawn from publicly observable chart structure on a fixed set of past ranges, reviewed here as part of Quantzee's analytical research; they are not a projection of future performance. Readers who want a regulator's framing of how speculative, pattern-based trading risk is described can see the FINRA investor resources hub. This page is analytical software commentary, not individualized investment advice, and nothing here should be read as a recommendation to buy or sell any instrument. Paper trade any structure-based idea before risking live capital.