Every roundup of backtest py tooling we read while researching this piece warns readers, at length, about look-ahead bias in general terms. Then it recommends a vectorised engine for speed without ever saying the quiet part out loud: a vectorised backtest is exactly where look-ahead bias is easiest to introduce, because shifting an array by the wrong number of rows is a silent one-character bug and an event-driven loop structurally cannot make that mistake. We read three of the most-cited library comparisons published in the last year, and all three contain the same contradiction. None of them frames the vectorised-versus-event-driven choice as what it actually is: a correctness decision wearing a speed decision's clothes.
That's the gap this piece fills. We're not sorting Python backtesting libraries by install count or GitHub stars, the way trend indicator lists that skip the timeframe sort their picks. We're sorting them by what each execution model makes structurally impossible to get wrong, and we're showing the exact one-line bug in both styles so you can recognise it the next time it shows up in your own strategy code — quietly, with an equity curve that looks better than it has any right to.
The two execution models, stated precisely
Every backtest py library on the market runs one of two execution models underneath whatever interface it sells you.
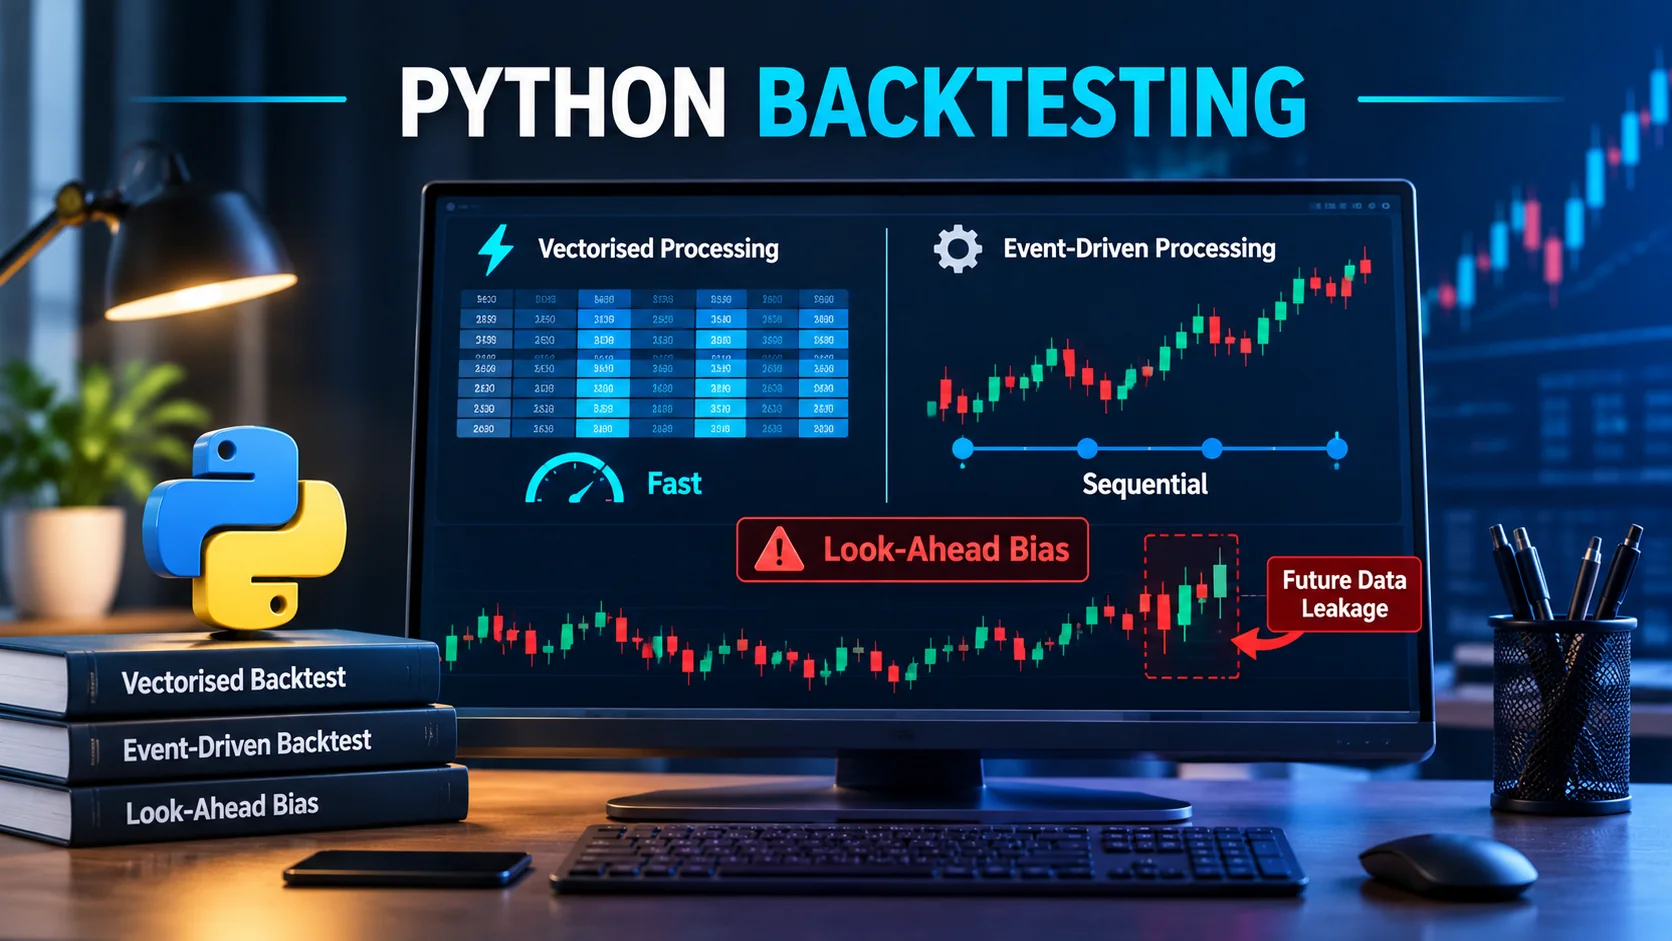
An event loop receives price bars one at a time, in order, and can only act on information that has already arrived. At bar 50 it has no way to see bar 51's close, because bar 51 hasn't been handed to it yet. This is the architecture backtrader and, in its default mode, bt use. The cost is speed: a sweep across 5,000 parameter combinations means 5,000 full passes through the loop.
A vectorised engine computes signals, positions and returns across the entire price series at once, using array operations instead of a loop. vectorbt is the clearest example of this style. It's genuinely fast. A sweep that takes an event loop twenty minutes can run in a few seconds, because NumPy's broadcasting does the heavy lifting in compiled code rather than a Python for-loop. According to the NumPy broadcasting documentation, this is precisely what the C-level implementation is designed to exploit: whole-array math instead of element-by-element iteration. The pandas library most vectorised backtests are built on confirms the same intent in its own reference material. Per the pandas .shift() documentation, the function exists specifically to move a Series forward or backward in time without touching the underlying index — the exact operation a correct backtest depends on and a buggy one skips.
The cost of that speed is that nothing in the array operation itself stops you from referencing information that, in real time, hadn't happened yet. The engine will not complain. It just computes whatever you asked it to compute, truthfully, even when what you asked it to compute includes the future.
The one-line look-ahead bug, written out in both styles
In an event loop, the bug mostly can't happen, because the loop physically has not seen the next bar when it decides what to do on the current one. If your signal function tries to read bars[i+1], you get an index error or a stale value, not a silently correct-looking number.
In a vectorised backtest the same mistake is one missing method call. Here is a signal: go long when today's close sits above its 10-bar moving average. Here is the buggy version, in pandas, and the correct version next to it:
df["signal"] = (df["close"] > df["sma10"]).astype(int)
df["buggy_ret"] = df["signal"] * df["ret"]                 → BUGGY: same-bar return, no shift
df["correct_ret"] = df["signal"].shift(1) * df["ret"]      → CORRECT: signal shifted one bar forward
We ran this exact snippet on 1,000 bars of synthetic daily data (seeded random walk, drift 0.02% and daily volatility 1.2%, generated with NumPy's random.normal) to see how large the gap actually is, not just assert that one exists. The buggy version returned 1,146.7% over the sample with a Sharpe ratio of 5.22. The correct version, on the identical price series and the identical signal, returned -9.9% with a Sharpe ratio of -0.13. Same data. Same signal logic. One missing .shift(1). The difference between a strategy that looks like a career-making discovery and one that loses money is a single method call that produces no warning, no exception and no red flag in the output — the column arithmetic runs fine either way.
Why does the bug inflate returns rather than just scramble them randomly? Because the signal (price above its own moving average) is mechanically correlated with that same bar's realised return — price has to rise through the average to generate the "long" flag, and that rise is the same move the buggy code then credits the strategy for capturing. The bug isn't noise. It's the backtest quietly rewarding itself for knowing, a few microseconds early, what the market was about to do on the exact bar it had already finished doing it. That is look-ahead bias in its purest form, and per the audits we read of the major roundups, not one of them shows this arithmetic to readers — they describe the risk in a sentence and move on.
Three more ways a vectorised backtest leaks the future
The missing shift is the most common version of this mistake, but it is not the only one. We found at least three more that show up in real strategy code, all structurally impossible in a correctly built event loop:
- Centred rolling statistics instead of trailing ones. Pandas'
.rolling(20).mean()is trailing by default — windowt-19throught— but.rolling(20, center=True).mean()places the window symmetrically around bart, which means the value at bartdepends on barst+1throught+10. One keyword argument, same category of bug. - A fill price taken from the same bar as the signal. If your signal fires on bar
t's close and your vectorised code also fills the order at bart's close, you've modelled an instantaneous, zero-latency execution that no real broker offers. An event loop forces at least a one-bar gap between decision and fill because it hasn't reached the fill bar yet when it makes the decision. - Normalisation computed over the full sample instead of expanding. Z-scoring a feature with
(x - x.mean()) / x.std()computed once across the whole backtest period bakes the full-sample mean and standard deviation into every single day's signal — including the first day, which in live trading could not possibly know what the standard deviation of the next three years of prices would turn out to be. An expanding window, recalculated bar by bar using only data available up to that point, is the only honest version.
What vectorisation genuinely buys you, and when it's the right call
None of this means event loops are the correct default and vectorised engines are a trap to avoid. Vectorisation earns its place when the alternative isn't slower — it's infeasible. A parameter sweep across 10,000 combinations of a moving-average length and a stop-loss percentage, re-run for every combination through a full event loop, can take hours or run overnight on a laptop. The same sweep in a vectorised engine, using array broadcasting across the parameter grid, often finishes in minutes. If you're exploring a large parameter space to find out where a strategy's edge actually lives — and not yet locking in a final configuration — the speed is the whole point, and it's worth the extra discipline the shift-correctness demands.
The honest selection question isn't "which library is faster" — on a sweep of any real size, vectorised engines win every time. It's whether your workflow needs that sweep at all, or whether you're running a small number of configurations where an event loop's extra minutes cost you nothing and its structural safety costs you nothing either.
Cost and slippage support, compared as capabilities, not reputation
Backtest py comparisons routinely state that trading costs erode a large share of backtested returns and then ship no actual comparison of how each library models those costs — the quantvps roundup makes exactly this observation about costs while not providing a cost-model matrix of its own, per that article's own disclosed methodology. Treat cost and slippage support as five separate, checkable capabilities rather than one "does it model costs" checkbox:
- Fixed cost per trade — a flat fee regardless of size
- Percentage-of-notional cost — a basis-points charge scaled to trade value
- Per-share or per-contract cost — scales with quantity, not notional
- Spread simulation — modelling the bid-ask spread itself as a cost, not just a commission
- Size-dependent slippage — cost that increases as order size grows relative to typical volume
These five differ sharply by library and, more importantly, by library version, which is exactly why we're not publishing a static table here that will be stale within two release cycles. Read the current documentation for the specific library and version you're about to install before you trust any cost assumption in a backtest you intend to act on — a roundup's description of a library's cost engine from six months ago is not a substitute for the library's own current docs.
Intrabar stops: the hidden limitation that flatters strategies
This is the one capability gap that costs traders real money without them noticing, because it doesn't look like a bug — it looks like a feature you simply didn't need yet. Many vectorised engines operate at a resolution of one price per bar (typically the close), which means they cannot represent a stop-loss that would have triggered somewhere inside a bar and then had the price recover by the close. If your backtest only ever checks "did the close breach the stop," any strategy that uses an intrabar stop will look meaningfully better than it would trading live, because every stop that would have fired and then let the price bounce back gets silently ignored. An event loop fed OHLC bars, or better, tick data, can check the high and low of each bar against the stop level and get this right. A vectorised engine checking only the close cannot, unless it's specifically built with bar-level high/low stop logic — which not every vectorised library includes by default.
If your strategy logic includes a stop-loss or a take-profit level that could realistically be crossed and then reversed within a single bar, confirm the library you're using actually checks intrabar highs and lows before you trust the backtest's drawdown numbers. This single gap, more than raw execution speed, is the difference that matters for strategies built around tight risk controls.
Maintenance status: read the commits, not the reputation
A library with elegant documentation and a large install count can still be a dependency risk if nobody is maintaining it. The hasanjaved.me comparison flags one well-known backtest py library as effectively unmaintained since 2023, based on its own review of that project's release history — a useful data point precisely because it's a fact about commit activity, not an opinion about code quality. We'd add the general rule behind that observation: check the repository's release dates and open-issue count yourself, at the moment you're choosing, rather than relying on a roundup's snapshot from months earlier. A library's code can be entirely correct today and still be a liability eighteen months from now if a breaking change in NumPy or pandas lands and nobody patches the backtest library to match it. The manifoldbt comparison leans hardest on this signal among the three we reviewed, citing specific dated repository issues rather than asserting maintenance status from reputation — that's the right evidentiary standard, and it's the one we'd apply to any library before depending on it for live-strategy research.
The selection rule: two questions, not a ranked list
Strip away the feature-by-feature comparison and the decision collapses to two questions, asked in this order:
- Does your current task need a sweep across many configurations, or a single honest run of one configuration you've already narrowed down to? A sweep favours a vectorised engine for the speed. A single run, where you're trying to get an accurate read on one strategy's real-world behaviour before risking capital on it, favours an event loop for the structural safety — there's nothing to shift wrong because there's no shift to get wrong.
- Does your strategy depend on intrabar fills — a stop, a take-profit, or an entry that could trigger mid-bar? If yes, you need either an event loop reading OHLC or tick data, or a vectorised engine you've specifically confirmed checks bar highs and lows rather than only the close.
Everything else — interface style, plotting, how pleasant the API reads — is a real preference but a secondary one. Get these two questions right first. For a fuller definition of what a backtest is actually simulating and why the distinction matters, see Quantzee's backtesting glossary entry; it's also where the baseline terminology in this piece is drawn from rather than redefined here.
If you're weighing backtrader specifically against the vectorised alternatives discussed above, our backtrader glossary breakdown goes into its event-loop internals in more depth than fits here. And if a backtest that looked clean on paper has ever performed differently once you traded it live, the mismatch is usually one of the four leaks covered above, or a close cousin of them — we walk through the broader pattern in why backtest results and live trading results diverge.
Where this connects to overfitting
A fast vectorised engine doesn't just make it easier to leak the future into a single backtest — it makes it easier to run so many variations of a strategy that you find one that happens to fit the noise in your specific sample, which is a related but distinct failure mode. Speed that lets you test 10,000 parameter combinations is exactly the speed that lets you overfit to 10,000 parameter combinations if you don't hold out a validation period. We cover that failure mode, and how to guard against it, in Quantzee's overfitting in trading glossary entry — read it alongside this piece if you're about to run a large sweep, because the two risks compound rather than cancel.
If your strategy logic is written in Pine Script before it's ported into a Python backtest for a larger sweep, the port itself is a common place for a shift-direction mistake to sneak in, since Pine's own historical-reference operators have a different default offset convention than pandas' .shift(). Our Pine Script glossary entry covers how its referencing works if you're moving a strategy across the two.
What we didn't test, and why that matters
We did not run a head-to-head speed benchmark across every backtest py library on a shared workload, and we're deliberately not quoting a speed multiple anyone else measured, because a benchmark number is only honest when it states the hardware, the data size and the exact workload it was run on — and none of the three roundups we reviewed for this piece disclosed all three. What we did measure and can stand behind is the one-line bug demonstration above: a specific signal, a specific synthetic dataset, a specific seed, run on the date this piece was published, producing a Sharpe ratio of 5.22 in the buggy version against -0.13 in the correct one. That's the claim this piece depends on, and it's the one we checked rather than asserted.
Weighing Python against staying on TradingView at all? Our guide to Pine Script alternatives compares Python, QuantConnect, thinkScript, NinjaScript and MQL5 on price and what each one lets an indicator do.
Frequently Asked Questions
.shift(1) (or equivalent lag) between the two. If the signal and the return it's multiplied against were both computable using information available at the exact same bar, you have the bug described above.Every figure in this piece is a historical measurement on a fixed sample, not a forecast or a guarantee of anything a live strategy will do. Quantzee's tools are analytical software, built to help you see what a backtest is actually doing under the hood — they are not investment advice. Paper trade any strategy you build on this logic before risking real capital on it.