A win rate with nothing behind it
Search for a 0DTE options strategy and you'll get a confident number within the first scroll: credit spreads win 60-75% of the time, long calls and puts win 10-20%, and a spread needs an 85% hit rate to survive. None of those figures comes with a sample size, a date range or a market regime. That gap is the whole story of this search result, and it's what this page is about.
We won't print a win rate here. We'll explain what a same-day win rate has to state before it means anything, show with plain arithmetic why a high win rate and a losing account sit together comfortably at this expiry, and then report our own measured result, which was negative. At Quantzee we hold our own numbers to the standard we're asking of everyone else.
What a 0DTE options strategy actually trades
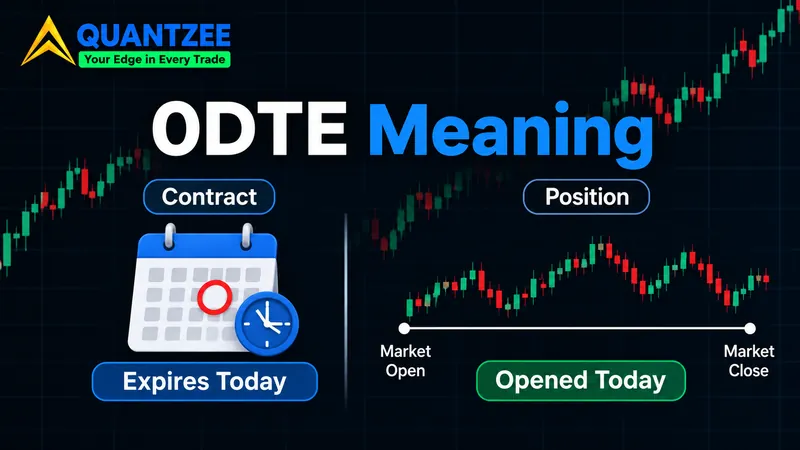
A 0DTE contract is an option on its last day of life, and "zero days to expiration" simply means it settles at today's close. If you want the finer distinction between a contract that is 0DTE and a position that is held as 0DTE, our 0DTE meaning explainer separates the two.
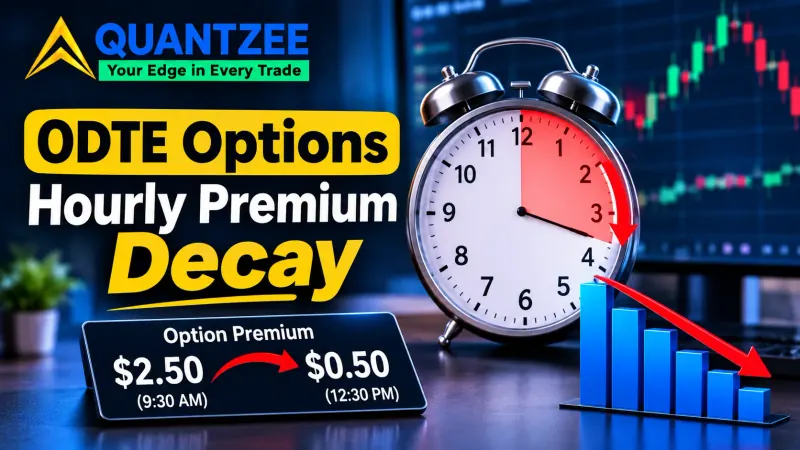
One structural fact follows from that single day: all of the option's remaining extrinsic value has to resolve inside one session. There's no tomorrow for time value to sit in, so the position's behaviour comes down to a race: how fast the underlying moves against how fast the premium decays. Gamma is at its maximum, which means the delta of a near-the-money strike can swing from 0.20 to 0.80 on a modest move. Theta decay is also at its peak, but it isn't spread evenly through the day. We tracked that uneven shape hour by hour in where a 0DTE contract's premium actually goes.
That race is why every result on this expiry is so sensitive to the details. Shift the entry by 30 minutes or the strike by one increment, and you're effectively running a different trade with a different history.
The five things a 0DTE win rate must state
A win rate is a ratio, and a ratio with no denominator is just a mood. Before a same-day win rate tells you anything, it has to state five things:
- Instrument. Which index or ETF, and which contract series. Cash-settled index options and physically settled ETF options behave very differently at the closing settlement.
- Date range. A 2021 sample and a 2025 sample come from entirely different volatility regimes. Without dates, you can't tell which one you're looking at.
- Sample size. How many sessions, and how many trades. Twenty sessions is barely a month, and a tail event that strikes once in 80 sessions won't show up in it at all.
- The exact structure. Strike selection rule (fixed delta, fixed distance, or premium target), entry time, exit rule and stop. "Credit spread" isn't a structure; "10-delta short, 5 points wide, entered at 10:30, closed at 2x credit or 3:45" is.
- Assumed trading cost. Commission per contract and the bid/ask assumption per leg. On this expiry, that single line can reverse the sign of the entire result.
Now hold the page-one guides against that list. We compared the three main content results for this keyword in November 2026. SpotGamma's guide, at around 8,700 words the authority page, gives win-rate bands for long premium and for credit spreads with no sample, no period and no regime attached. MarketXLS's guide, about 5,500 words, says disciplined sellers tend to be profitable and cites nothing for it. Tradewink's guide, the most thoroughly sourced of the three, sets out what a spread needs to win and shows only hypothetical accounts. Not one of them passes item 3, and not one passes item 5.
That isn't a criticism of the individual writers. It's hard to publish a real same-day sample, because the honest numbers are usually unflattering, and our own certainly were.
Why a high win rate can still lose money
Here's the arithmetic with round, hypothetical figures chosen for clarity. These are illustration numbers, not a measurement, so treat them as a teaching example. Say you sell a 5-point-wide credit spread on an index each session and collect $0.80 per spread, or $80 per contract. Your maximum loss on each contract is the $5.00 width minus the credit, which is $4.20, or $420.
Run it for 21 sessions, which is about one month of trading, and suppose it wins 17 days and loses 4. That's an 81% win rate, right in the band the guides like to quote.
- 17 winning days x $80 = $1,360 gross.
- 4 losing days, closed on a stop at an average loss of $300 each = $1,200.
- Net before costs: $160 for the month.
Now add a fifth loser and take one winner away. The win rate drops to 76%, which is still inside the band. Gross wins fall to $1,280, losses climb to $1,500, and the month is down $220. One extra bad session out of 21 was enough to flip the outcome of the whole month. If any of those losing days runs to the full $420 instead of a $300 stop, the hole gets deeper. Stops on a same-day contract are also prone to slip, because gamma can push the spread through your stop price between two quotes.
Win rate measures how often you're right, but it says nothing about how much you lose when you're wrong. On this expiry, small frequent wins and rare large losses is the normal shape, so a win rate on its own will nearly always flatter the structure.
Trading cost is the decisive term, not a footnote
Go back to that month and add costs. Assume $0.65 per contract per leg in commission, which is a common retail rate, and a $0.05 slip per leg against the mid price on entry.
A two-leg spread costs $1.30 in commission to open and $10 in slip, so about $11.30 per entry. Across 21 sessions that's $237. The four losing days also need a closing trade, which adds roughly $45 more. The month that netted $160 before costs is now down about $122. Nothing about the structure changed; only the cost line did.
The reason is simple: the credit per round trip is small, and round trips happen every day. A $0.05 slip on an $0.80 credit is about 6% of the gross on each leg. On a four-leg iron condor you pay it eight times per round trip if you have to close. Our data shows the same thing at scale, as the next section reports: every extra round trip made the result worse.
The single most useful question to ask of any 0DTE claim is what cost the author assumed. If the answer is "none" or "not stated," the number is a gross figure dressed up as a net one.
The structures searchers expect, as payoff mechanics
People who type "best 0dte options strategy" into a search box usually mean one of three structures. Here they are described purely as payoff mechanics. This is how each one makes and loses money, not a suggestion to trade any of them.
Defined-risk credit spread
You sell one option and buy a further out-of-the-money option on the same side. Maximum profit is the net credit, and maximum loss is the width of the strikes minus the credit. Breakeven sits at the short strike plus or minus the credit received. With a 5-point spread and $0.80 credit, breakeven is $0.80 beyond the short strike and the worst case is $4.20 per spread.
Iron condor
Two credit spreads at once, one on the call side and one on the put side. You collect two credits and profit if the underlying stays between the two short strikes. There are two breakevens, one on each side, and the maximum loss is one spread's width minus the total credit, since price can only breach one side at a time. Our iron condor glossary entry walks through the legs. The catch on a same-day condor is that it has four legs, so its cost per round trip is double a single spread's.
Long call or put
You pay a premium for the right to buy or sell at the strike. Maximum loss is the premium paid, while the profit side is open-ended in theory. Breakeven at expiry is the strike plus (call) or minus (put) the premium. On a 0DTE contract the underlying has to move far enough, fast enough, to beat a decay that runs all session. That's why long premium typically posts a low win rate, and also why its occasional winners can be disproportionately large.
The unbounded side matters for anyone selling naked. A short strangle, with no wings, has no fixed maximum loss on either side. The straddle vs strangle page shows how the two differ. On a volatile day, the uncapped leg can cost many multiples of the original credit.
Our own result: a negative, reported in full
We built an engine to test one specific idea: take a technical-indicator signal and, instead of trading the index, sell options against it. Here is what we measured, stated against the same five-item list.
- Instrument: intraday options on a large-cap equity index, closed within the same session.
- Date range: January 2025 to October 2026.
- Sample: 438 trading sessions. For the condor run, 19,052 signals produced 2,792 entered structures after the position cap and other filters.
- Structure: an RSI-based signal, sold as a short strangle 5 strikes out of the money; then as an iron condor with wings 4 strikes beyond each short.
- Cost: first at zero slippage and zero friction, then at two higher slippage levels per leg.
The short strangle lost money at zero trading cost, which is the most generous test you can run, and it still failed. The iron condor version lost about 2.6 times as much per day as the strangle, again at zero cost. Its trade win rate at zero cost was 7.8%. At the highest friction level the day win rate fell to 0.26% of 378 traded days, and the median position gave back 65.1% more than its credit. Buying the wings made the result worse, not safer, because each additional leg added transaction cost and the signal had no measurable edge to pay for it.
We then swept 18 structure variants: three short-strike distances, three wing widths and two stop levels, run over a 40-session window. 0 of 18 cleared our entry gate, and every one failed on the minimum average daily result. The tighter stop and the wider wing each produced more round trips, and more round trips meant more cost.
We found something useful in the wreckage, too. The signal's forecast of the underlying's adverse move correlated only 0.0844 with what the option position actually lost. The realised move of the underlying, by contrast, correlated 0.4026 with that same loss. A short option's loss comes from the underlying move plus the change in implied volatility plus the decay, and a chart signal only sees the first of those.
A note on scope: this is a result for one signal, one market and one window. It isn't a claim about every same-day strategy, and it isn't a currency or market-specific claim; it's an example of what a published sample looks like, warts and all.
The volume story: the one sourced fact on page one
The part every guide gets right is the remarkable growth in trading activity. SpotGamma's page reports that same-day contracts reached around 63% of index-option volume in February 2026, up from roughly 20% in 2020, citing exchange data. MarketXLS gives a lower 40-50% share and doesn't link a source. The gap between those two numbers is mostly a matter of which product and which month each one measured, which is exactly the point about stating your sample.
For the primary figures, go to the exchange itself. Cboe's insights pages publish the volume series directly. For a plain-language grounding in how options work and the risks involved, the Options Industry Council, FINRA's options overview and Investor.gov's options entry are the right starting points. According to FINRA, options can expire worthless and carry risks that differ from owning the underlying, which matters more, not less, when expiry is today.
What an indicator can and can't contribute
Quantzee builds analytical indicators, so it's worth being direct about their limitations here. An indicator reads the underlying's chart, where it can show trend, momentum, range expansion and where volatility is building. It doesn't price an option contract, it doesn't model the gamma profile across strikes, and it can't see the implied-volatility change that our own test showed drives a big share of a short option's loss.
That makes an indicator a contextual tool for the underlying, not a pricing engine for the individual contract. If you want that context, our guide to indicators for index options explains which chart signals relate to option behaviour and which don't. The volatility index guide covers the regime side, and the TradingView indicators for options traders page lists the chart tools themselves. Before trusting any rule you build on top of them, run it through a strategy stress-test checklist.
What this page is, and isn't
This page describes structures and reports one measurement. It isn't a recommendation to trade any 0DTE options strategy, and nothing in it is a forecast of returns. Our methodology section above gives you everything we'd want from anyone else: the instrument, the dates, the sample, the structure and the cost. The next time a guide quotes you a same-day win rate, ask for those five things first. If they're missing, the number is a guess, however precise it looks. Paper trade first if you test anything on this expiry.