Short answer: what a green candlestick means
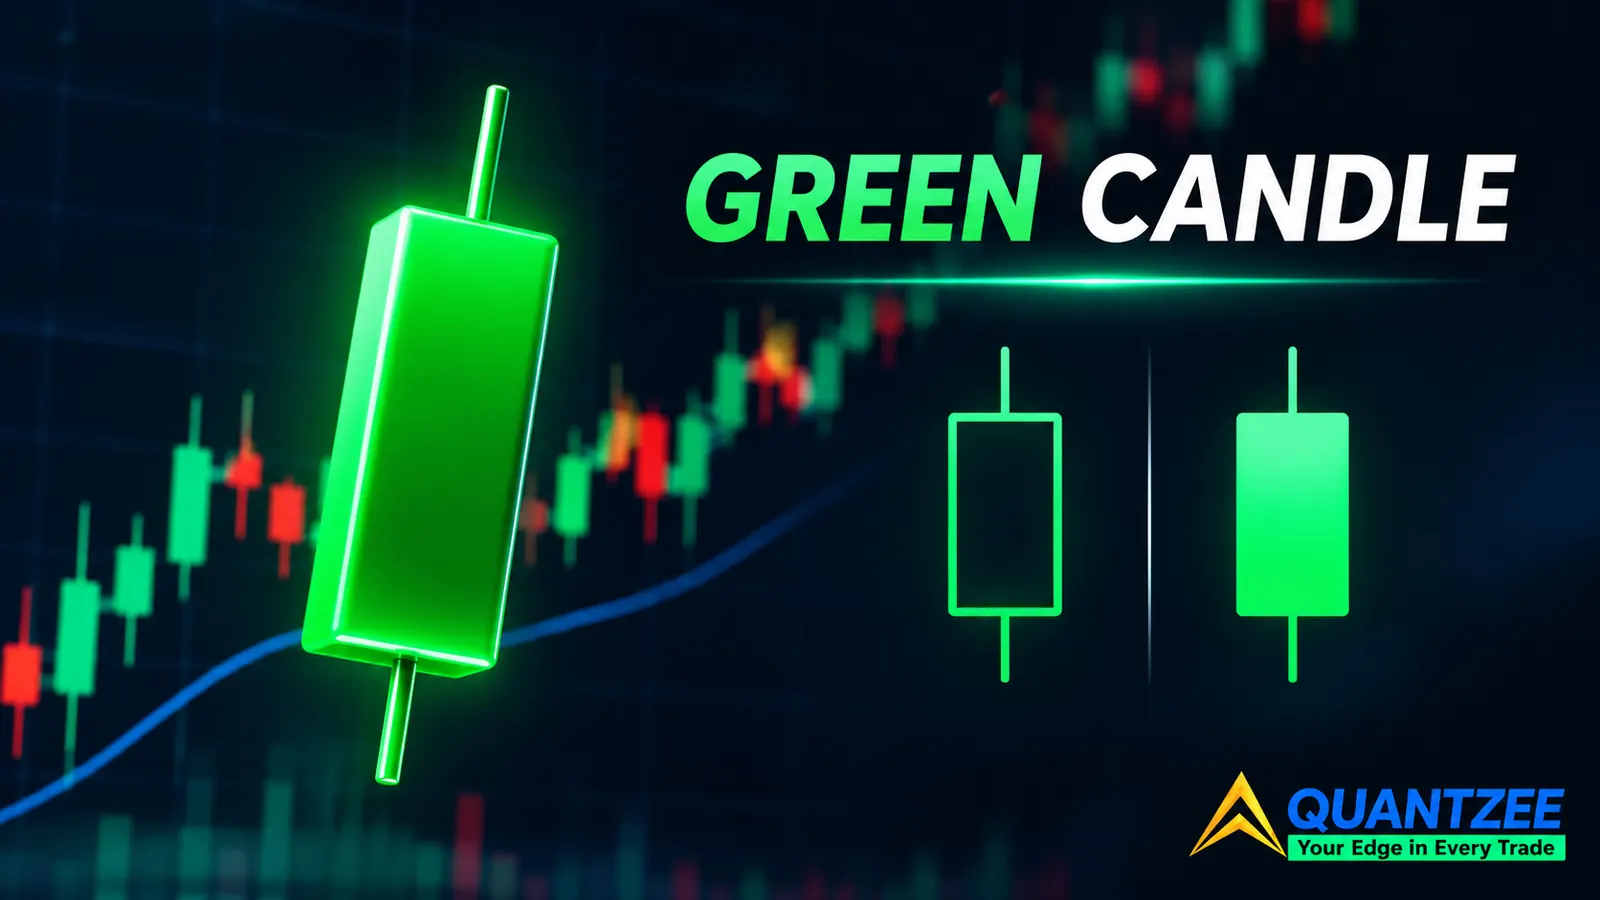
The green candlestick meaning most guides give is this: price closed above where it opened, so buyers won the bar. On a plain candlestick chart with default settings, that's correct. The trouble is the phrase "on default settings." Quantzee readers use many charting platforms, and several of them offer a second colouring rule where a green body can sit on a candle that closed below its own open. If you don't know which rule your chart is using, a green candle tells you less than you think.
This post lays out both rules, draws the exact bar where they disagree, and gives you a one-minute check to run on your own chart. It also covers what a single green candle can and can't tell you. For the full pattern library this sits inside, see our candlestick patterns cheat sheet ranked by reliability.
The two colouring rules in use on live charts
Every candle carries four prices: open, high, low and close. The body spans open to close. The wicks reach the high and low. Colour is a separate decision the charting software makes, and there are two common ways to make it.
Rule A: colour from close against open
This is the default on ordinary candlestick charts. If the close is above the open, the candle is green. If the close is below the open, it's red. The colour and the body direction always agree, because they're answering the same question: did this bar finish higher or lower than it started?
Rule B: colour from close against the previous close
Hollow-candle modes, and some volume-candle modes, split the job in two. Colour answers a different question: is this bar's close above or below the previous bar's close? The body itself is drawn hollow when the close is above the open and filled (solid) when the close is below the open. So the fill carries the within-bar story, and the colour carries the bar-to-bar story.
Educational pages on hollow candles, such as the ones from TrendSpider and The Trading Bible, describe this fill-versus-colour split. Two of the three top-ranking pages we looked at state both rules in the same article without pointing out that they conflict. A reader who absorbs both sentences ends up holding two incompatible definitions of "green."
TradingView's help centre documents candle styles and colour settings in its candles knowledge-base entry. Check the option names on your own platform against it before assuming anything, since labels and defaults vary between products and change over time.
The conflict case, drawn out
When the two rules disagree, you get one of two odd-looking candles. Here's a deliberately simple, hypothetical illustration. The numbers are invented for the drawing and are not a real quote.
- Previous bar closes at 100.
- The next bar opens with a gap down at 96, trades up, and closes at 98.
Under Rule A, that bar is green: 98 is above its own open of 96. Under Rule B, it's red, because 98 is below the previous close of 100. But Rule B also draws the body hollow, since the close is above the open. So you see a red, hollow candle: an up-body painted in the "down" colour.
Flip the picture. The previous bar closes at 100, the next one gaps up and opens at 104, then fades and closes at 102. Rule A paints it red (102 is below 104). Rule B paints it green (102 is above 100) and draws it solid, because the close is below the open. That's a green, filled candle: a down-body painted in the "up" colour.
The four combinations on a hollow chart
Colour and fill are independent channels, so a hollow chart produces four looks, not two:
- Green and hollow: closed above the prior close, and above its own open. Strong on both counts.
- Green and filled: closed above the prior close, but below its own open. The bar sold off after opening high, or gapped up and faded.
- Red and hollow: closed below the prior close, but above its own open. The bar recovered after opening low.
- Red and filled: closed below the prior close and below its own open. Weak on both counts.
The two mixed combinations are the ones that confuse people. They're also the ones carrying the most information, because they say "the gap and the session disagreed."
Why gapping charts flip so many more candles
The two rules only disagree when the open is not equal to the previous close. If every bar opened exactly where the last one closed, Rule A and Rule B would paint identical colours on every candle. The gap between the prior close and the next open is the whole source of the conflict.
That's why the issue is far bigger on a daily chart of an equity than on a symbol that trades around the clock. A stock that trades for a set session each day closes, sits idle overnight, and reopens at a price shaped by whatever happened in between: earnings, news, a broader market move. Gaps are routine. A symbol that trades 24 hours has opens that sit very close to the previous close, so the two rules agree on nearly every candle, and the problem hides.
The same logic applies on intraday bars. Within a continuous session, the first bar after a pause or session open is where the disagreement concentrates. Mid-session bars rarely gap.
What colour throws away
Colour is one bit of information. Whichever rule you use, you're compressing the bar into "up" or "down." The body and wick lengths keep far more:
- Range. High minus low tells you how much the market moved, not just which way it finished.
- Close location. A close near the high of the range and a close near the low can both sit under the same colour. Where the close lands inside the range is a separate and more useful reading.
- Rejection. A long upper wick on a green candle says price was pushed away from the high. That's the same logic behind the hammer, which is only half a signal until the next two bars confirm it.
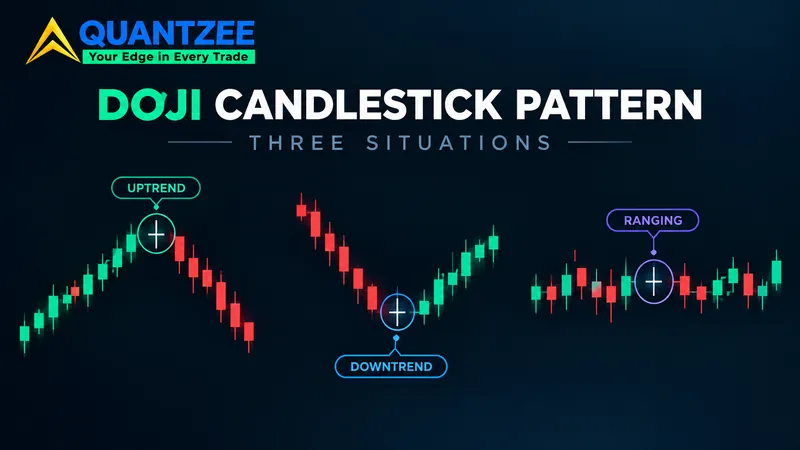
Two candles can both be green and carry opposite stories. One closes at the top of a wide range after a clean push. The other has a tiny body, a huge upper wick, and a close barely above the open. If your read stops at colour, you can't tell them apart. We covered the same trap in our post on the doji candlestick pattern and its three situations: the shape of the body relative to the range matters more than the label.
A one-minute check for which rule your chart is on
You don't need to read documentation. Use a gap day.
- Open a daily chart of any equity or ETF and scroll back to a day that clearly gapped. Earnings days are easy to find.
- Click the candle and read its open, high, low and close from the data window.
- Look up the previous day's close.
- Now compare. If the candle gapped down but closed above its own open, check the colour. Green means your chart is on Rule A. Red means it's on Rule B (or a hollow mode).
- Do the same for a gap-up day that faded. Red means Rule A. Green means Rule B.
If the colour matches the close-versus-open answer on both days, you're on Rule A. If it matches the close-versus-previous-close answer, you're on Rule B. Two days is enough. Write the result down next to your chart settings so you don't have to redo it, and redo it whenever you change chart type or platform.
If you backtest or screen on candle colour, this matters more than it seems. A rule written as "green candle" will select a different set of bars on each convention. Whatever definition your code uses, it needs to match the definition on the chart you looked at when you formed the idea. Otherwise your eyes and your test are describing two different populations.
Does a single green candle carry any edge?
We haven't computed a hit rate for single green candles for this post, and we're not going to quote one that someone else did. Be sceptical of any page that hands you a percentage with no window, no instrument list and no costs attached. A single green candle is also one of the most common events on any chart, so even a small effect would be hard to separate from noise.
What we can give you is the test design, so you can run it yourself:
- Fix one instrument or a fixed basket, one timeframe, and one date window. Decide all three before you look at results.
- Mark every green candle under Rule A. Separately, mark every green candle under Rule B.
- For each set, record the direction of the next bar's close against the green candle's close.
- Compare the two sets with each other and with the same count for red candles and for a random sample of bars.
- Split the window in half. If the result only shows up in one half, treat it as unproven.
Count how many bars sit in the gap-conflict zone, too. That count tells you how much the two conventions actually differ on your instrument. On a continuously traded symbol it may be tiny, and then the question is academic. On a gapping stock it can be large.
Next-bar direction is a blunt measure. A more careful version tracks the size of the next move relative to the average range, and charges costs against it. But even the blunt version will tell you quickly whether "green" on its own separates anything. Our expectation, based on how crowded and well-studied this ground is, is that colour alone separates very little, and that context does the work. That's an expectation, not a result.
This is analytical education, not advice. Paper trade any idea first, and don't treat a single candle as a trade trigger. Our engulfing candles guide shows the same lesson from another angle: the identical shape behaves differently at a meaningful level than in the middle of a range.
A worked read of one candle, step by step
Take the hypothetical gap-down bar from earlier: previous close 100, open 96, close 98. Suppose the high was 99 and the low was 95. Now read it without colour at all.
- The range is 4 points (99 minus 95). The body is 2 points, so half the range is body.
- The close at 98 sits three-quarters of the way up the range. The low wick is 1 point and the upper wick is 1 point.
- The bar opened 4 points below the prior close and recovered half of that gap, but not all of it.
That's a useful description: a gap that buyers partly repaired and closed near the top of the day's range. Notice that it holds up on either colouring rule. Rule A calls the bar green, Rule B calls it red, and the description doesn't change. If you can write the read in those terms, you never depend on which rule the chart happens to use. Try the same exercise on the next five candles you were about to label by colour alone. It takes about two minutes, and it usually changes at least one of your readings.
Practical rules for reading green candles
Pick one rule and stick with it. If you mix charts from different platforms, note the rule on each. When you read a candle, look at the body, then the wicks, then the close location, and treat the colour as a label rather than the message. When a candle looks "wrong," a green down-body or a red up-body, check for a gap before you check for a bug.
It also helps to read about how markets work from neutral sources. Regulators and investor-education bodies explain concepts such as gaps and trading sessions without selling a system. See FINRA's overview of stocks for background on how equity trading sessions work, and Investor.gov from the U.S. SEC for general investor education.