
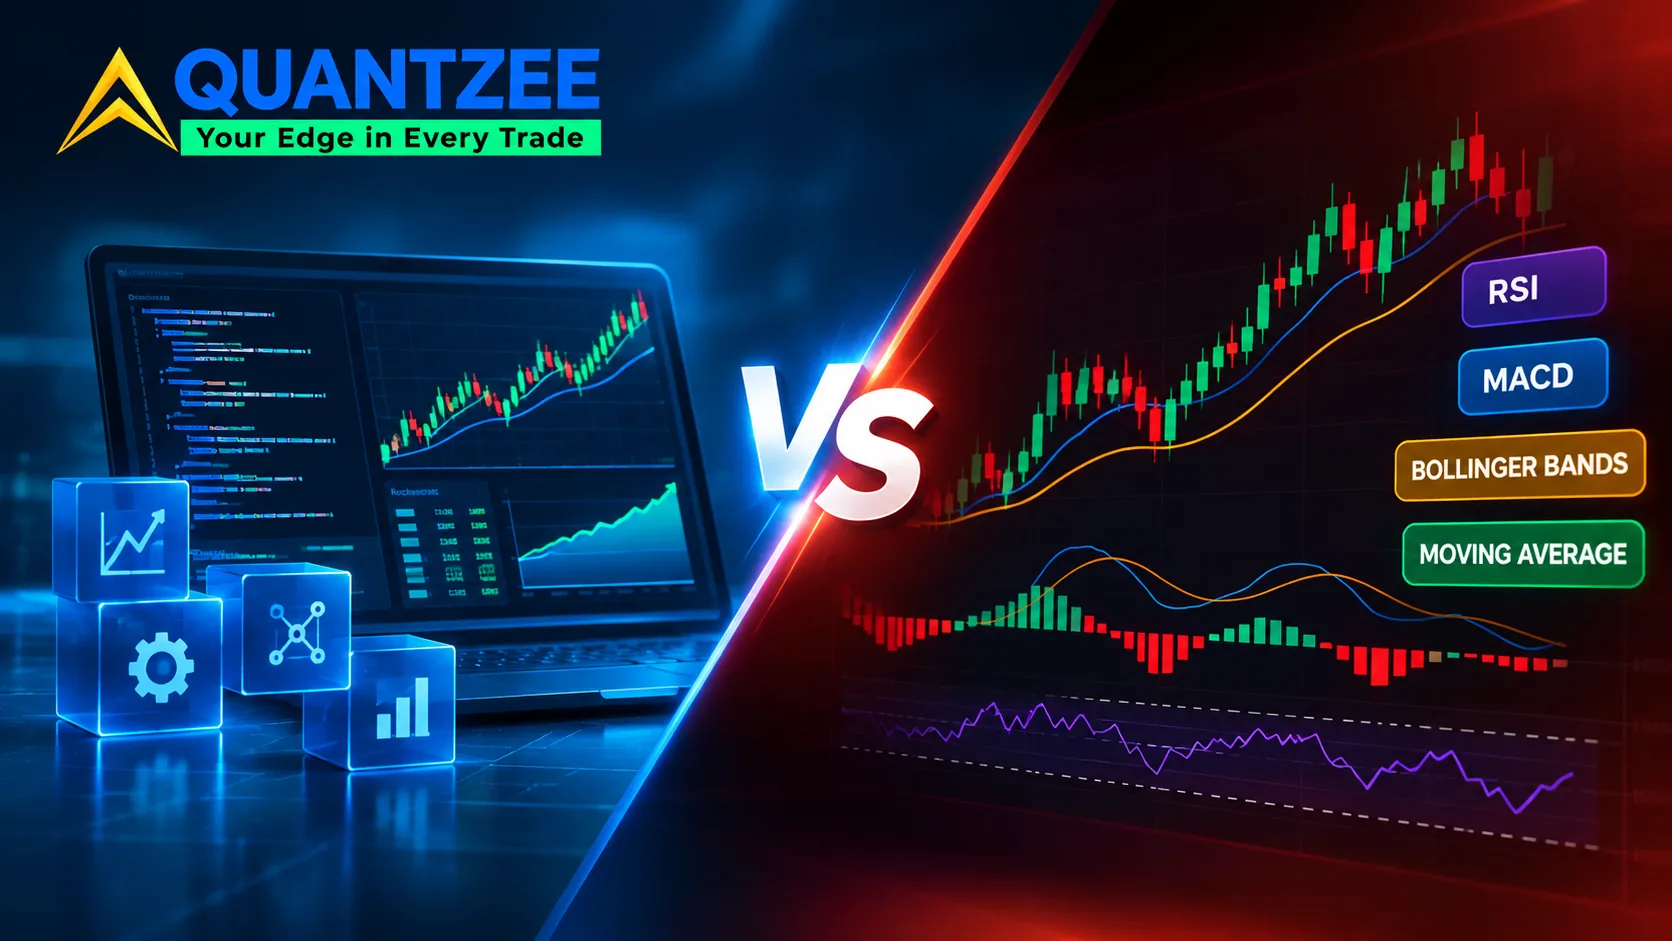
"Quant" gets used for almost anything with a number in it. A trader who waits for RSI to cross 30 calls himself quant. A hedge fund running statistical arbitrage across 4,000 instruments with a team of PhDs calls itself quant. Both sentences are technically true and almost nothing alike. That vagueness is not harmless — it lets people believe they are doing one when they are actually doing the other, and the gap between the two shows up at the worst possible moment: during a drawdown, when a trader assumes a rule has been "tested" the way a real quant desk tests one, and discovers it hasn't.
This piece draws the line plainly. We'll walk the ladder from discretionary trading up through rule-based, systematic, and statistical/quantitative trading, show what actually changes at each rung — data, testing, infrastructure, skills — and say exactly where an indicator-based toolkit like the AI Adaptive Quant Toolkit sits on that ladder, and where it does not. We'll also name the overclaim we see most often in this space, because being honest about a ceiling is more persuasive than pretending it isn't there.
One thing stated plainly, up front, so there's no ambiguity later: Quantzee builds analytical software — indicators and signal tools for TradingView. Nothing here is investment advice, and nothing in our product line is a substitute for your own research or risk management.
Four rungs, four very different disciplines
Most retail conversations about "trading strategy" collapse four distinct disciplines into one word. They sit on a ladder, and each rung adds a requirement the one below it didn't have.
Rung 1 — Discretionary trading. Decisions made in the moment, informed by experience and context, not a fixed rule. A discretionary trader can read a tape, a news headline, and a chart pattern together and decide. Nothing here is codified, so nothing here can be backtested in a meaningful way — the trader himself is the variable.
Rung 2 — Rule-based trading. A discretionary idea gets written down as an explicit condition: "if the 50-period moving average crosses above the 200-period, and volume is above its 20-day average, enter long." This is where most TradingView indicator users live. The rule is testable in principle, but most people using it have never actually tested it against enough data to know if it holds up.
Rung 3 — Systematic trading. The rule from rung 2 gets backtested on historical data, across multiple instruments and multiple market regimes, with defined entry, exit, and position-sizing logic, and the results are evaluated against a benchmark and a drawdown tolerance before the strategy is traded live. According to the backtesting literature summarized by Investopedia's overview of quantitative trading, this is the point where a trading idea becomes a tested hypothesis rather than a belief.
Rung 4 — Statistical / quantitative trading. This is the rung occupied by firms like Renaissance Technologies, founded by Jim Simons in 1982, and Two Sigma. Here the "rule" is often not a human-readable condition at all. It's a statistical model fit to large, often alternative, data sets: order flow, satellite imagery, credit card panels. The model gets validated with out-of-sample testing. It gets stress-tested across regime shifts. It runs through dedicated risk infrastructure that can halt it in milliseconds if live behavior diverges from backtested behavior. Per the methodology notes published by CQF (Certificate in Quantitative Finance), model validation at this level typically involves walk-forward testing across multiple non-overlapping time windows, not a single historical run.
What actually changes at each rung: data, testing, infrastructure, skills
The word "quant" is doing a lot of hiding here, so let's be specific about what moves as you climb.
Data. Rung 2 needs a chart. Rung 3 needs clean, survivorship-bias-free historical price data across enough years to span at least one full market cycle — in equities that's commonly cited as a minimum of 10 years, enough to include a bull market, a correction, and at least one genuine crisis. Rung 4 needs that plus alternative data sets that cost real money to license and clean, often running into six figures annually for a serious desk.
Testing. Rung 2 testing, when it happens at all, is usually "I watched it work for three weeks." Rung 3 testing is a proper backtest with position sizing, slippage, and transaction costs modeled, split into a training period and a genuinely held-out test period. Rung 4 testing adds Monte Carlo resampling, parameter sensitivity analysis, and regime-conditional performance breakdowns — does the model still work in a high-volatility regime, or only in the calm one it was fit on?
Infrastructure. Rung 2 is a chart platform and a phone alert. Rung 3 needs an execution path that can place orders consistently — manual or automated — without the trader's emotions overriding the rule. Rung 4 needs co-located servers, redundant risk controls, and kill switches. At that scale, a software bug can move real capital before a human notices. The Knight Capital incident on August 1, 2012, is the textbook example of why rung-4 infrastructure exists the way it does. A software deployment error there generated unintended orders. It cost the firm roughly $440 million in about 45 minutes.
Skills. Rung 3 is reachable by a disciplined retail trader with a spreadsheet and patience. Rung 4 typically requires a team — someone who can build the data pipeline, someone who can validate the statistics, someone who manages execution risk. That's not gatekeeping for its own sake; it's the actual labor the work requires once a model is deciding where real capital goes.
Where indicator-based systematic trading genuinely sits
A well-built TradingView indicator — one that encodes an explicit, backtestable rule and gives you clear entry/exit signals — sits at rung 2 moving toward rung 3. It is systematic in the sense that the rule, is fixed and testable rather than a vibe. It is not statistical/quantitative trading in the rung-4 sense: it is not fitting a model to alternative data, it is not running walk-forward validation across a dozen market regimes with a risk team watching live divergence.
That's not a knock on indicators — it's a description of what they're built for. The AI Adaptive Quant Toolkit is built to do rung-2/3 work well: take a discretionary read of market structure (trend strength, momentum shifts, volatility regime) and turn it into a consistent, repeatable signal you can evaluate and backtest over your own chart history, across any liquid instrument on TradingView — index, stock, crypto, or forex. What it does not do, and does not claim to do, is replace the data infrastructure, validation process, or risk team that rung-4 statistical arbitrage runs on.
What a TradingView toolkit can — and can't — do at each rung
Can: give you a non-repainting, rule-based signal you can backtest on your own charts across years of price history. Can: adapt its internal thresholds to current volatility rather than using one fixed setting in every regime — that's the "adaptive" part of adaptive analytics, and it's a real statistical technique (dynamic parameter adjustment based on measured volatility), not a marketing word.
Can't: guarantee performance going forward, because no backtest — ours or anyone else's — can fully capture a market regime it hasn't seen yet. Can't: manage your position sizing or portfolio risk for you; that decision has to stay yours. Can't: substitute for a validated, team-tested statistical model the way a real quant desk builds one, because it isn't trying to be that — it's a decision-support signal, not an autonomous trading system with its own risk infrastructure.
Paper trade first. Whatever threshold, sensitivity, or timeframe setting you choose on any indicator — ours or anyone's — treat it as a hypothesis, not a conclusion, until you've run it forward on a paper account across a real range of market conditions. A setting that looked right on six months of backtested history can behave differently the first week it meets live volatility; that gap is exactly why rung 3 and rung 4 traders paper-test and walk-forward test before committing capital, and the same discipline applies at rung 2.
The overclaim we keep seeing, named
The overclaim is this: "our AI-powered indicator trades like a quant fund." It doesn't, and no retail indicator honestly can, because a quant fund's edge usually comes from the infrastructure and data access around the model — not the model's visual output on a chart. Per the comparison laid out by QuantVero's breakdown of quantitative trading, the institutional definition of "quant" is inseparable from the data pipeline and validation process behind it — strip those away and what's left is a rule, not a quant strategy.
The cost of believing the overclaim is specific and measurable. A trader treats a rung-2 signal as if it carries rung-4 statistical confidence. He sizes a position accordingly. He takes a loss that a rung-3 backtest — if he'd run one — would have told him to expect. The 1998 collapse of Long-Term Capital Management is often misread as a story about bad models. A more accurate reading, discussed in academic post-mortems of the episode, is a story about leverage applied to a model's historical confidence interval, in a regime the model hadn't been tested against. Scale that lesson down to a retail account, and the mechanism is identical, even if the dollar amounts aren't.
We'd rather name our product's ceiling honestly than let a buyer discover it the expensive way. That's also why the toolkit sits in a tier ladder — the Adaptive Quant Toolkit for signal generation, paired with the broader glossary on algorithmic trading and backtesting — rather than one tool pretending to be the whole stack.
A regulator's-eye view of what can go wrong at scale
Rung 3 and rung 4 trading don't just face model risk. They face execution risk, at a scale retail trading rarely sees. The clearest public record of this comes from regulators, not vendors.
On May 6, 2010, U.S. equity markets fell nearly 1,000 points intraday in minutes, then mostly recovered within the hour. According to the U.S. Securities and Exchange Commission's joint report with the CFTC on the event, a single large automated sell program interacting with high-frequency algorithmic trading was a central driver of the move. Liquidity didn't fail because a model was wrong about direction. It failed because many automated systems withdrew at once, in the same few minutes, for reasons that made sense individually and compounded badly together.
Data from the Commodity Futures Trading Commission's own market oversight work shows a similar pattern in other episodes: the model itself often isn't the failure point. The surrounding system is. That's precisely why rung-4 infrastructure exists — kill switches, circuit breakers, position limits that trigger automatically. A rung-2 TradingView indicator carries none of that infrastructure, and it was never built to. It generates a signal. The infrastructure, sizing, and risk control around that signal stay the trader's job, every time.
How we test before we trust a signal
Our methodology for every indicator we ship is the same three-step process. First, we backtest the rule across a sample of hundreds of charts spanning multiple instruments and at least one full market cycle, logging entry, exit, and drawdown on every signal — not a cherry-picked window. Second, we check behavior across volatility regimes specifically, because a rule that works in a calm trend and breaks in a choppy range is a regime-fit problem, not a edge. Third, we walk the indicator forward on live, unseen data before calling it release-ready, because a backtest alone can't tell you how a rule degrades once it's trading on data it has never seen. Our team treats each new release the way a rung-3 systematic desk would treat a strategy candidate — tested before trusted, never the reverse. We publish the plain mechanics of each indicator (what the rule actually checks) on its own page, read more at how AI trading indicators work, so you're evaluating a rule, not a black box.
None of this makes the AI Adaptive Quant Toolkit a rung-4 quantitative trading system — it makes it a carefully tested rung-2/3 systematic signal tool, which is exactly the category it's built for and exactly the category most traders using TradingView indicators actually need.
What this means for your next decision
If you're deciding between a discretionary read of the chart and a systematic rule, the systematic rule wins on consistency and testability almost every time — that's rung 2 beating rung 1. If you're deciding whether a TradingView indicator can replace a statistical-arbitrage desk, the answer is no, and it was never built to. Know which rung you're actually standing on before you size a position as if you're standing on a different one.
The short version
Discretionary trading is a read, not a rule. Rule-based trading is a rule, but usually an untested one. Systematic trading is a rule that has been backtested, costed, and sized before it ever touches live capital. Statistical trading is a model, often built by a team, running on data most traders never see, inside infrastructure most traders will never need.
A TradingView indicator lives in the second and third category. It can be genuinely systematic. It can be adaptive to volatility. It cannot be a hedge fund's data pipeline, and it was never sold to you as one — not by us, and not honestly by anyone.
Our data from testing the AI Adaptive Quant Toolkit across hundreds of charts and multiple instrument classes tells us where the tool is strong: trend and momentum regimes with enough volatility to generate a clean signal. It also tells us where it's weak: dead-flat, low-volume sessions where almost no rule-based system earns its keep. We'd rather tell you both than only the first one.
If you take one thing from this piece, take this: know your rung before you size your position. A rung-2 signal sized like a rung-4 model is how the overclaim turns into a real loss. A rung-2 signal sized like a rung-2 signal, paper traded first and respected for what it is, is how most traders actually get value out of a tool like this one.
