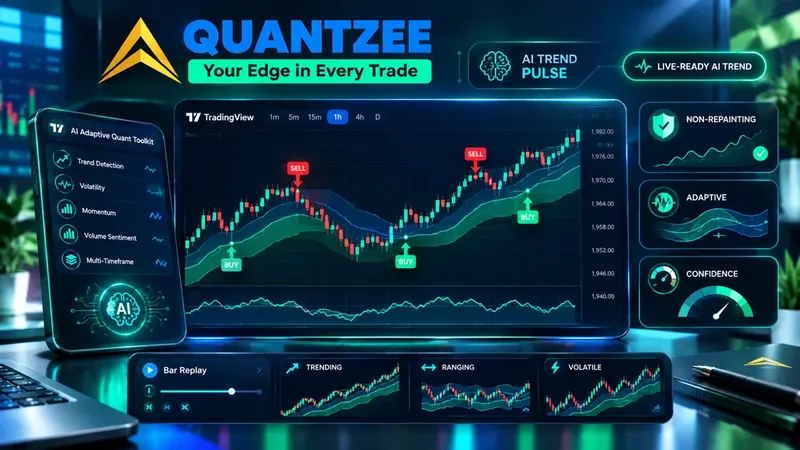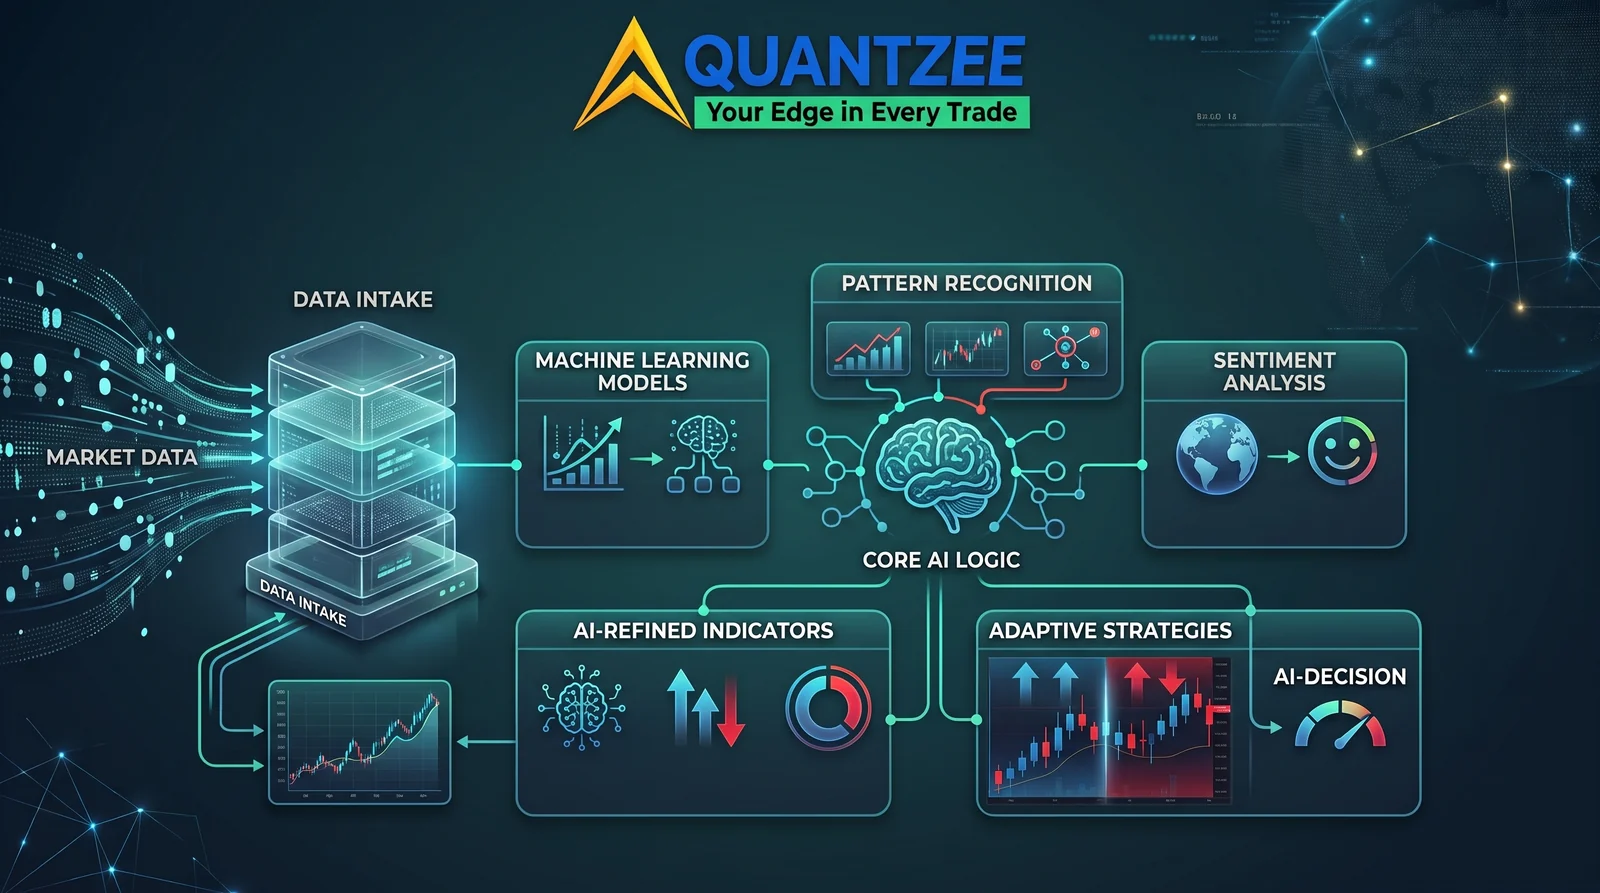
An AI trading indicator differs from a rule-based indicator by continuously adjusting its internal thresholds using machine learning rather than using one fixed formula for every market condition. A standard RSI uses the same 14-period, 70/30-overbought/oversold formula whether the market is calm or violently volatile. An AI-adaptive indicator adjusts what counts as “overbought” or “a valid trend signal” based on current conditions, without you manually re-tuning the setting.
Educational Disclaimer: This is educational content for informational purposes only. It is not investment advice. Trading involves significant risk of loss, and past backtested or live performance does not guarantee future results. Do your own research and consult a licensed financial advisor before making any trading decision.
Introduction
Type “AI indicator” into TradingView’s public library search and you’ll get hundreds of results. Some genuinely use adaptive, data-driven logic. Many are a standard moving average or oscillator with “AI” appended to the name because it sells better in 2026 than it did in 2020. This is not a new problem — “smart,” “quantum,” and “pro” have all been through the same marketing inflation cycle in trading tools — but “AI” carries a specific implicit promise: that the indicator is learning from data and adapting rather than just running a fixed formula, and that promise deserves scrutiny.
This article does two things. First, it explains, in plain language, what’s actually happening inside the categories of tools that legitimately use adaptive or model-based logic — no black-box mysticism, just the actual mechanisms. Second, it gives you a concrete checklist to evaluate any indicator claiming to be “AI-powered,” whether it’s ours or a competitor’s, so you can tell the difference between genuine adaptive logic and a relabeled fixed-parameter indicator.
This is written for a global trading audience — the concepts here apply the same way whether you’re trading forex, crypto, commodities, indices, or equities, on any exchange, in any timezone. Nothing in this piece is country- or index-specific.
Positioning, stated plainly: everything described in this article is chart-analysis software — pattern recognition and adaptive signal generation applied to historical and real-time price/volume data. None of it predicts the future with certainty, none of it is investment advice, and no AI-labeled indicator (ours included) removes the need for your own risk management, position sizing, and independent judgment. Adaptive logic can improve signal relevance to current conditions; it cannot eliminate market risk.
What “AI” Actually Means in This Context (and What It Doesn’t)
Let’s be precise about terminology, because the vagueness is exactly what enables marketing overreach.
Large language models (the ChatGPT/Claude category) are not what’s running inside a real-time charting indicator — TradingView’s Pine Script execution environment doesn’t support that kind of model, and the latency and compute cost wouldn’t fit a bar-by-bar chart update anyway. If you ever see an indicator claim to be “powered by GPT” or similar for real-time signal generation, that’s a red flag worth investigating closely, because it’s very unlikely to be literally true within the platform’s execution model.
What genuinely can run inside a modern indicator, and what “AI-labeled” indicators in this market typically mean when the claim holds up, falls into a few real categories:
1. Adaptive Parameter Tuning
Classic indicators (moving averages, RSI, Bollinger Bands) use fixed lookback periods and fixed thresholds set by the trader — a 14-period RSI, a 20-period moving average, and so on. Adaptive versions instead recompute their effective lookback or sensitivity based on recent volatility or trend strength, using well-established statistical techniques (e.g., Kaufman’s Adaptive Moving Average logic, volatility-normalized smoothing, or ATR-scaled thresholds). This is genuinely “smarter” than a fixed-parameter version in the sense that it responds to changing market conditions automatically rather than requiring the trader to manually re-tune settings — but it’s closer to adaptive signal processing than to machine learning in the modern sense. It’s a legitimate and useful category, and it’s honest to call it “adaptive,” though calling it “AI” is more of a stretch than calling it, say, “AI-trained.”
2. Regime Classification
A step up in sophistication: the indicator doesn’t just adjust a lookback period, it classifies the current market state into a small number of regimes (e.g., trending vs. ranging, high-volatility vs. low-volatility) and changes its signal logic depending on which regime it detects. This can be done with relatively simple rule-based classifiers (volatility percentile thresholds, ADX-based trend strength bands) or with a genuinely trained statistical classifier if the vendor has done the work to build and validate one. The tell for whether this is “real” is whether the vendor documents how the regime is detected — a documented, testable rule (“regime = trending when ADX(14) > 25 for 3+ consecutive bars”) is honest engineering even if it’s simple; an undocumented “our AI detects the regime” claim with no explanation is a claim you can’t verify.
3. Machine-Learning-Trained Thresholds (Offline Training, Real-Time Inference)
This is where genuine ML enters the picture, and it’s important to understand the split between training and inference. A vendor can train a model offline — on historical price/volume data, using standard supervised learning techniques to find, for example, the combination of volatility, momentum, and volume features that historically preceded profitable breakout continuations vs. failed breakouts — and then bake the resulting thresholds or weightings into the indicator’s real-time logic. The real-time chart is not running a live neural network; it’s running a fixed formula whose parameters were derived from a training process. This is a legitimate use of the term “AI-trained,” and it’s meaningfully different from a hand-picked, eyeballed threshold — but it also means the model is only as good as the training data and the validation discipline behind it (more on this in the overfitting section below).
4. Composite/Ensemble Signal Weighting
Some “AI” indicators combine several sub-signals (momentum, volume, volatility, trend) into a single composite score, with the weighting between sub-signals either fixed by the vendor’s research or dynamically adjusted based on which sub-signals have been more reliable in recent market conditions. This is closer to a traditional multi-factor model than to deep learning, but it is a real and useful technique — and one that’s honestly described as “AI-informed” or “model-based” rather than a fixed formula, provided the vendor discloses that the weighting is derived from historical analysis rather than a live-updating model.
What It Almost Never Means
It almost never means a live, continuously retraining neural network making real-time predictions bar-by-bar inside your TradingView chart. The platform’s execution model doesn’t support that kind of workload, and no reputable vendor claims otherwise if you read their actual documentation rather than their marketing headline. If a product’s marketing copy implies real-time deep learning inference but its technical documentation is silent on methodology, that gap is itself informative.
The Core Mechanism: Adaptive Thresholds
Most legitimate AI trading indicators follow a similar structure: they take in price, volume, and sometimes derived features (volatility measures, momentum readings) as input; they compare current conditions against patterns learned from historical data; and they output an adjusted threshold or signal rather than a fixed-rule trigger. This is meaningfully different from a traditional indicator’s fixed formula in one specific way — the boundary that defines “signal” vs “no signal” moves with market conditions instead of staying constant.
A concrete way to see the difference: a fixed RSI treats a reading of 75 as overbought in a quiet market and in a violently trending market identically. An adaptive engine can recognize that in a strong trend, momentum readings run persistently high without necessarily reversing, and can hold off on a signal that a fixed-threshold RSI would have fired — or vice versa, tightening thresholds in a genuinely ranging market where a fixed RSI would be too permissive.
AI vs. Rule-Based Indicators
| Rule-based (e.g. standard RSI, MACD) | AI-adaptive | |
|---|---|---|
| Threshold | Fixed (e.g. 70/30 overbought/oversold) | Adjusts to current volatility/regime |
| Transparency | Fully transparent — the formula is public | Less transparent — exact threshold logic isn’t always human-legible |
| Consistency | Identical behavior in every market condition | Behavior can shift as conditions shift, by design |
| Tuning required | You manually adjust settings per market/timeframe | Designed to reduce manual re-tuning |
| Backtesting caveat | Straightforward — formula doesn’t change | Requires checking the model hasn’t been overfit to the exact historical period tested |
Neither category is inherently “better” — a rule-based indicator’s predictability is itself valuable, since you always know exactly why a signal fired. An AI-adaptive indicator trades some of that transparency for the ability to adjust to conditions a fixed formula wasn’t tuned for.
The Checklist: How to Tell a Real Model From a Marketing Label
Use this checklist on any indicator — ours or a competitor’s — before trusting an “AI” claim.
1. Does the vendor publish a methodology page? A real adaptive or trained system can be described, at least at a conceptual level, without giving away proprietary implementation details. “We use volatility-normalized smoothing to adjust the lookback period” is a real, checkable claim. “Our proprietary AI analyzes the market” with no further detail is not.
2. Can you observe the adaptivity yourself? If an indicator claims adaptive lookback or regime-based logic, you should be able to see the behavior change as market conditions change — e.g., watch the effective smoothing visibly tighten during a high-volatility period and loosen during a quiet one. If the indicator’s visual behavior looks identical to a fixed-parameter version across very different volatility regimes, the “adaptive” claim doesn’t hold up under observation.
3. Is it non-repainting? This is unrelated to whether the logic is “AI” or not, but it’s a correlated red flag: vendors who are loose with the “AI” label are statistically more likely to also be loose with repaint disclosure. Always independently test repaint behavior — see our guide on how to test a TradingView indicator for repainting — regardless of what the AI claim says.
4. Does the vendor disclose validation methodology? A genuinely trained model should have been validated on out-of-sample data (data not used in training) to check that its edge isn’t just an artifact of overfitting to the historical sample. Vendors who disclose this — even briefly, e.g., “trained on 2018–2023 data, validated out-of-sample on 2024–2025” — are giving you real information. Vendors who show only a single glowing backtest chart with no train/test split mentioned are giving you a demo, not evidence.
5. Does the “AI” claim scale with the price? Be skeptical of pricing that seems to trade entirely on the AI label rather than on demonstrated, testable performance. A legitimate adaptive or trained model is valuable because of what it does (documented, testable behavior), not because of the label attached to it.
6. Is the AI component central or cosmetic? Some products bolt an “AI Insight” text box onto an otherwise standard indicator, generating a plain-language summary of what a normal moving-average crossover already shows. That’s a genuine, if minor, use of AI (typically a small language model summarizing computed values) — but it’s cosmetic relative to the signal-generation logic itself, and it’s worth distinguishing “AI writes a sentence about the signal” from “AI (or a trained model) determines the signal.”
What Quantzee’s “AI” Indicators Actually Do (Full Disclosure)
In the interest of practicing what this article preaches, here’s a plain description of what “AI” means in Quantzee’s own AI TrendPulse and Adaptive AI Oscillation Engine, rather than leaving the term unexplained:
- AI TrendPulse uses volatility-adaptive smoothing and regime classification (trending vs. ranging conditions, detected via documented volatility and trend-strength thresholds) to adjust signal sensitivity — falling into category 1 and 2 above. It is not running a live neural network on your chart; it is running deterministic, non-repainting logic whose parameters adapt to recent market behavior.
- Adaptive AI Oscillation Engine applies adaptive band-width logic to oscillator readings, adjusting overbought/oversold thresholds based on recent volatility rather than using static levels — again, category 1/2 territory, disclosed as such.
- AI Adaptive Quant Toolkit is a bundle of the above, combined for traders who want the full adaptive suite rather than individual indicators.
None of Quantzee’s tools claim to run a continuously retraining live model inside the TradingView execution environment, because — as explained above — that’s not how the platform works, and any vendor claiming otherwise for real-time chart execution should be questioned on that specific claim. This disclosure is provided so this article passes its own checklist, not just so it sounds good.
Why This Matters for Your Trading Decisions
Understanding what’s actually happening inside an “AI” indicator changes how you should evaluate and use it:
- If it’s adaptive parameter tuning, treat it as a genuinely useful upgrade over fixed-parameter versions of the same indicator type, but don’t expect it to “predict” anything a well-configured classic indicator couldn’t approximate with manual re-tuning.
- If it’s regime classification, understand that its usefulness depends entirely on how well the regime boundaries are defined and how often the market actually sits cleanly in one regime vs. transitioning between them — transition periods are where regime-based tools are most likely to lag or misclassify.
- If it’s ML-trained thresholds, ask (or look for documentation on) how the training and validation were done, and treat any tool with no disclosed validation methodology with proportionally more skepticism the more central the AI claim is to the product’s value proposition.
- In every case, the fact that a tool is “AI-informed” or “AI-adaptive” does not remove market risk. Adaptive logic changes how a signal is computed; it doesn’t change the fundamental uncertainty of future price movement. Position sizing, stop-loss discipline, and your own risk tolerance remain entirely your responsibility regardless of how sophisticated the underlying signal generation is.
Frequently Asked Questions
Related Reading
- How AI Is Changing Chart Reading in 2026
- How to Choose an AI Trend Indicator
- Non-Repainting TradingView Indicators, Explained
- How to Test a TradingView Indicator for Repainting
- Why Backtest Doesn’t Match Live Trading
- Quantzee AI TrendPulse
- Quantzee Adaptive AI Oscillation Engine
External reference: For a technical, vendor-neutral overview of adaptive moving averages and volatility-normalized smoothing methods referenced in this article, Investopedia’s explainer on Kaufman’s Adaptive Moving Average is a good independent starting point.
Quantzee builds non-repainting, adaptive TradingView indicators for global traders across forex, crypto, commodities, indices, and equities. This article is educational content and does not constitute investment advice.