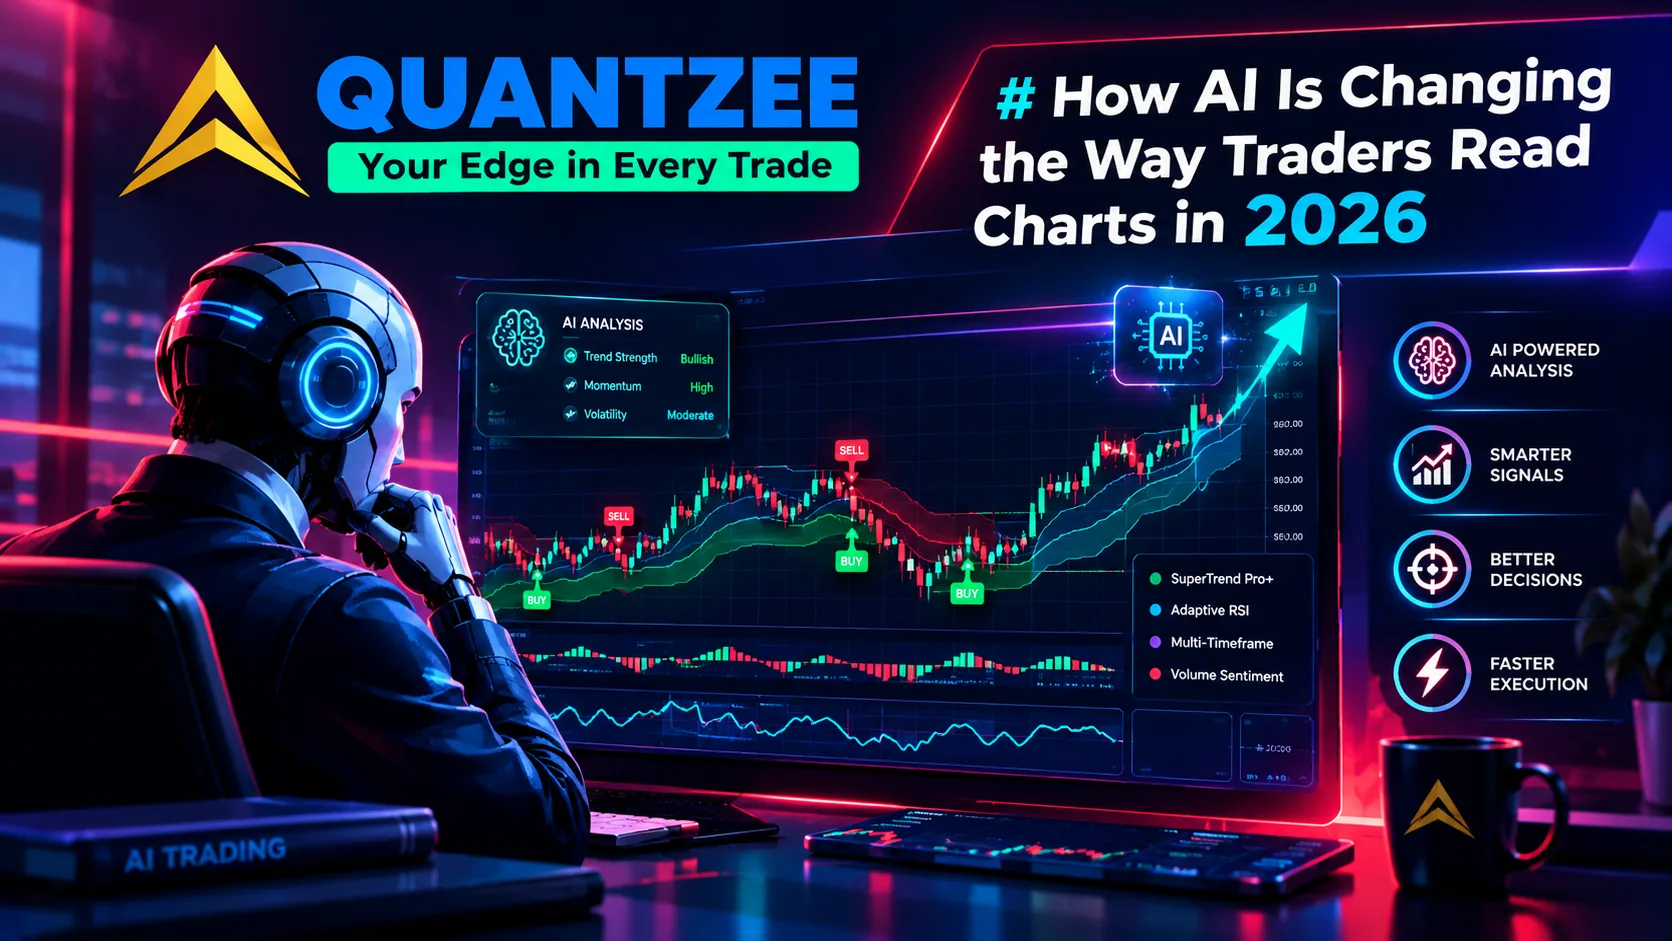
For decades, reading a chart meant the same handful of moves. Drop a moving average, add RSI, draw a trendline, eyeball the structure, and make a call. The tools were static formulas invented in an era of paper charts, and traders adapted themselves to the tools. In 2026 that relationship is inverting. Increasingly, the tools adapt to the trader and to the market, and that single shift is changing how charts get read at a fundamental level.
This is not about robots replacing traders. It is about what changes when the analysis layer stops being a fixed formula and starts being something that learns from conditions. Here is what is actually different now — and what the “AI-labeled” trap looks like up close.
⚡ Key Takeaways
- Genuine AI-adaptive indicators adjust their noise filter to current volatility — ATR-narrow bands in quiet markets (more responsive), ATR-wide bands in volatile markets (fewer false signals) — without manual re-tuning between sessions or assets.
- The single most important test for any "AI" indicator: screenshot a signal the moment it fires, wait 5–10 candles, and check the same bar. If anything changed, the indicator repaints and its backtest history is fiction.
- AI changes the quality and scale of inputs — scanning dozens of charts, flagging setups in real time — but does not change who is responsible for the trade decision, stop loss, or position sizing.
- If an indicator produces the same signal density on a calm forex pair and a volatile crypto session with identical settings, the "AI" adaptation is cosmetic — genuinely adaptive tools show visibly different behavior across volatility profiles.
- Quantzee's non-repainting architecture is the same across the whole suite — test the repainting guarantee yourself before subscribing to any paid AI tool.
From fixed formulas to adaptive analysis
A classic indicator does exactly one thing forever. A 14-period RSI computes the same way on a calm bluechip and a violent altcoin, in a quiet range and a screaming breakout. That consistency is also its weakness. The market changes character constantly, and a frozen formula cannot.
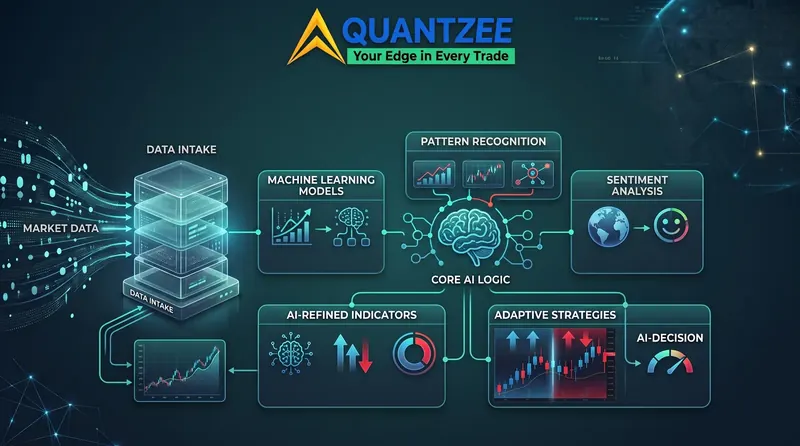
The defining change in 2026 is adaptiveness. Modern AI-driven indicators adjust their sensitivity and behaviour to current volatility and regime instead of applying one rigid setting to every chart. In practice that means fewer false signals in chop and faster recognition when a genuine trend begins, because the tool is reading the environment rather than ignoring it. Investopedia’s overview of artificial intelligence frames the core idea well: systems that adjust their output based on patterns in data, which is precisely what separates an adaptive indicator from a static one.
This is the substance behind our own AI indicator suite, where the logic shifts with conditions rather than forcing one formula onto every market.
What “adaptive” actually means in practice: the ATR example
The word “adaptive” gets used loosely in indicator marketing. Here is what it means technically, using ATR (Average True Range) as the clearest example.
A traditional trend indicator — say, a 20-period EMA — applies the same smoothing constant to every bar regardless of market conditions. On a day when BTC/USDT moves 0.3% per hour, that 20-period EMA is fine. On a day when it moves 4% per hour, the same EMA is generating whipsaws every ten minutes because the normal “noise” of the market now exceeds the signal threshold the formula was calibrated for.
An ATR-adaptive indicator solves this by making the noise filter proportional to current volatility. In concrete terms, the ATR multiplier in the volatility band scales dynamically:
- Low volatility regime (ATR reads 0.2% of price): The band is narrow, allowing the indicator to flip quickly on even modest directional moves — because in a quiet market, a modest move is meaningful.
- High volatility regime (ATR reads 1.5% of price): The band widens proportionally, requiring a larger move before the trend label changes — because in a noisy market, a small move is just noise.
The result is that the same ATR-adaptive indicator on a calm forex pair fires tight, frequent signals in trend, while on a volatile crypto session it fires fewer, wider signals — not because the settings changed, but because the volatility input is recalibrated on every bar. This is the mechanical substance of what separates a genuinely adaptive tool from one that just lets you manually change a multiplier setting.
Real-time pattern recognition, without the eye strain
The second major change is speed and scale of perception. A human can watch a handful of charts well. Watching forty across crypto, forex, and indices simultaneously, catching the moment a pattern completes on each, is simply beyond human attention.
AI does not get tired or distracted. It can scan many instruments at once and flag a setup the instant it forms, then alert you. That does not remove your judgement; it removes the grunt work of staring. You spend your attention deciding whether a flagged setup is worth taking, rather than spending it hunting for setups in the first place. The result is broader market coverage with less screen time, which is a meaningful change in the daily experience of trading.
Traditional vs adaptive: the same chart, two very different reads
To make the difference concrete, consider what the Gold (XAUgold) 1H chart looked like during a typical week in Q1 2025, when price was grinding sideways with a slight bullish bias before a sharp spike on a US jobs print.
Traditional 20-period EMA on that chart:
- During the sideways grind, the EMA crossed price five times in both directions over three days, generating five entries — of which four would have been stopped out on subsequent candles.
- On the spike bar itself (the jobs print), the EMA immediately crossed bullish — but by then, 60% of the move had already happened in a single candle.
- After the spike, the EMA required seven more candles to “confirm” the new level before it stabilised above, meaning the pullback-re-entry signal came very late.
ATR-adaptive trend indicator on the same chart:
- During the sideways grind, the volatility band widened to absorb the price oscillation, generating only one trend flip in three days (a brief excursion below the band that immediately reversed) rather than five.
- When the jobs spike hit, the adaptive band recalibrated within one to two candles to the new volatility regime, producing a confirmed directional signal earlier than the lagging EMA.
- The post-spike pullback was absorbed within the new, wider band rather than triggering a premature reversal signal.
Same chart. Same candles. The difference is in whether the noise filter scales to the market. Over a week of Gold trading, that compression from five false signals to one or two is the difference between a frustrating experience and a usable tool.
Case study: a major stock index — from repainting alert to non-repainting discipline
Consider how this plays out for a typical index trader watching a major stock index on a 15-minute chart during an intraday session.
The old workflow: Open the chart, apply a combination of RSI, MACD, and a 9/21 EMA crossover. Spend the first 30 minutes of the session watching conflicting signals — RSI showing oversold while EMA shows a bullish cross while MACD histograms are still negative. Spend the next 30 minutes waiting for all three to agree, by which time the setup has largely played out.
The problem with a typical AI-branded tool: Many “AI indicators” available on TradingView Marketplace in 2025 and 2026 showed attractive backtests but produced different signal history every time you loaded the chart fresh. That is the repainting problem. A buy signal that looked clean hours later was not the same signal that would have existed at the time it printed — it had been retroactively painted once later candles confirmed it. Trading this indicator live would have given completely different results than the published performance suggested.
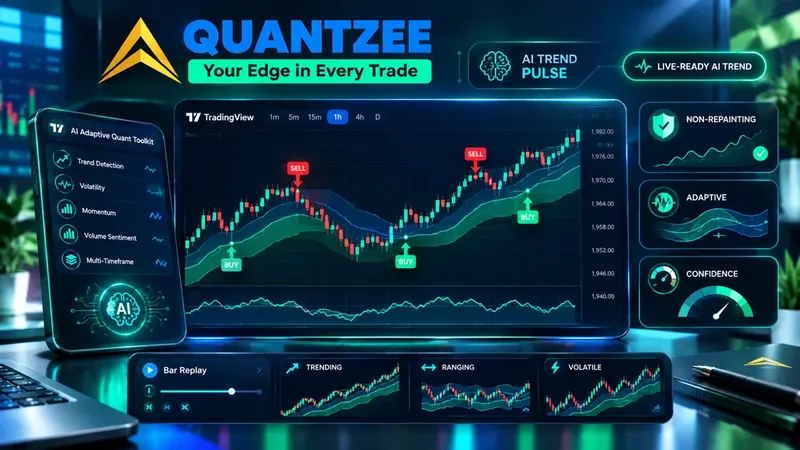
What a non-repainting, adaptive tool changes: The signal fires once, at bar close, and never changes. On the index 15M, an adaptive trend indicator with a volatility band would:
- Stay neutral during the pre-open futures churn
- Print a directional signal once the opening range establishes itself, typically within the first 10-15 minutes of the session
- Maintain that signal through intraday pullbacks that do not exceed the ATR-scaled band
- Flip only on a genuine reversal that meets the threshold
The practical outcome is two to four signals per the index intraday session rather than ten to fifteen crossovers, and each signal is the one that would have been visible at that exact moment — no retroactive editing.
The repainting trap: what “AI-labeled” really means
Here is where the 2026 conversation gets serious, because “AI” has become a marketing sticker slapped on plenty of tools that do not deserve it. The honest dividing line is whether a tool’s signals are non-repainting.
A repainting indicator works like this: signal logic fires at bar close using data only available at that close — so far, so good. But the signal’s visual presentation — the colour, the arrow, the label — is re-evaluated every time a new bar closes. If later bars “confirm” that the earlier signal was right, the old bar’s signal gets painted more clearly or switched on. If later bars invalidate it, the old signal quietly disappears or flips.
The result: you open a chart and see a beautiful run of correct calls in history. But if you had been watching live at those exact moments, you would have seen a very different, messier sequence. The history was written after the fact.
How to spot a repainting tool:
- Apply it to a chart and take a screenshot of a specific bar’s signal.
- Wait for five to ten more candles to close.
- Look at the same bar again. If anything changed — signal colour, direction, presence or absence — it repaints.
Quantzee’s non-repainting TradingView indicators are built on forward-calculated logic specifically to eliminate this failure mode. When you evaluate anything calling itself AI, this test cuts through the marketing.
The distinction also matters commercially. If a tool vendor cannot clearly state whether signals repaint, treat that as a no. Credible providers will say it explicitly because it is a genuine technical commitment, not a default feature.
What stays exactly the same
For all the change, the parts of trading that matter most have not moved an inch. Risk management is still the difference between survival and ruin. Position sizing, stops, and discipline are still yours to own. An AI signal is an input, not a command, and the trader who treats it as a command will lose just as surely as the one who chased every RSI cross a decade ago.
What AI changes is the quality and reach of the inputs. It does not change the responsibility for the decision. The best traders in 2026 are not the ones who blindly follow an algorithm; they are the ones who use better tools to inform sharper, still-human calls. Our roundup of the best TradingView indicators for 2026 reflects exactly that balance, and you can see how access is structured on the pricing page.
Wanting to verify before committing?
If you are curious about what an adaptive, non-repainting indicator looks like in practice, Quantzee’s indicators — such as MACD Pro+‘s adaptive chop-zone filter and divergence engine — can be added to any TradingView chart today.
The full suite is $9.99/month with no free tier or trial. But you can still run the repainting test above on any indicator before deciding whether to subscribe, and see what consistent signals look like in practice.
Where this is heading
The direction is clear. Chart reading is moving from “apply a fixed formula and interpret it” toward “let an adaptive system surface and contextualise opportunities, then decide.” The trendline and the moving average are not disappearing; they are being joined by tools that adjust, scan, and alert at a scale and speed no human can match.
The traders who thrive will be the ones who embrace the better inputs without surrendering the judgement — and who insist on the non-repainting standard as a baseline requirement, not a bonus feature. AI is changing how charts get read in 2026. It is not changing who is responsible for the trade.
Quantzee indicators are analytical software tools designed to assist your own analysis. This content is for educational purposes only and does not constitute investment advice. Do your own research. Trading involves risk of capital loss. Quantzee is not a registered investment advisor. Analytical software, not investment advice.