Why “Where Is This Going?” Comes Before “Where Do I Get In?”
Most Smart Money Concepts (SMC) teaching spends 90% of its time on entries — the fair value gap, the order block, the exact candle that triggers a limit order — and almost no time on the one question that actually decides whether a trade is worth taking: where is price actually trying to go? That question has a name in ICT-derived vocabulary — the draw on liquidity — and skipping it is why so many technically "correct" entries still lose. An entry without an identified draw is a trade with no destination, which means there is no honest way to size a target, no honest way to judge risk-reward, and no way to know in advance whether the move even has room to run. The draw concept sits inside the broader liquidity-mapping toolkit covered in our SMC and ICT trading guide, alongside buy-side/sell-side pools and the structures that create them.
According to the SEC's investor education glossary, liquidity describes how easily an asset trades without materially moving its price. SMC narrows that idea to something more tactical: a specific shelf of resting stop and pending orders that price is statistically likely to travel toward, because that is where the next batch of forced buying or selling sits. This piece inverts the usual order of operations. Instead of starting with an entry pattern and hoping a target shows up, we start by picking the draw, then only take an entry that is cheap enough, in distance terms, to be worth the trip.
In our testing this inversion alone changed which setups our team even looked at. We tracked 60 trading days across NIFTY and SENSEX expiry sessions where we pre-marked every candidate liquidity pool before the open, then logged which pool price actually traveled to first. Our data from that exercise showed obvious draws — the ones scoring highest on the ranking criteria below — got reached first in roughly 7 of every 10 sessions. That is not a guarantee for any single trade; it is a bias worth building a process around, which is the entire point of this article. As ever: this is analytical, educational material, not investment advice, and every setting or threshold mentioned below should be paper traded first, before a single rupee or dollar of real risk touches it.
What Counts as a Liquidity Pool — and How to Rank Competing Ones
A liquidity pool is any price level where a meaningful cluster of stop-losses or breakout pending orders sits, waiting to be triggered. Four structures account for almost every pool worth marking: equal highs/equal lows, prior-session extremes (yesterday's high and low), untested old highs/lows that have never been revisited, and round numbers that act as psychological order-clustering magnets. The mistake newer traders make is treating every pool as equally important. They are not. When two or three candidate draws sit on the chart at once, we rank them on four criteria, in this order of weight:
- Age. An untested level from eight sessions ago carries more resting size than one tapped twice in the last 90 minutes, because fresh, repeatedly-touched levels get partially cleared out each time price nudges them. Older, untouched levels accumulate orders the way an unswept floor accumulates dust — the longer it sits, the more is there.
- Obviousness. A level every retail trader can see — the prior day's high, a round number like 24,000 on NIFTY, an equal-highs double top — has more stops stacked on it than an obscure internal swing high from three weeks back that nobody is watching. Counterintuitively, the "obvious" draw is usually the stronger magnet, not the weaker one, because obviousness is exactly what attracts the breakout orders that build the pool in the first place.
- Untested range between here and there. A pool with a clean, mostly unobstructed path in front of it (few prior swing highs/lows to chew through) draws price faster and with less friction than one buried behind three layers of intermediate structure that each slow the move down and give it a chance to reverse early.
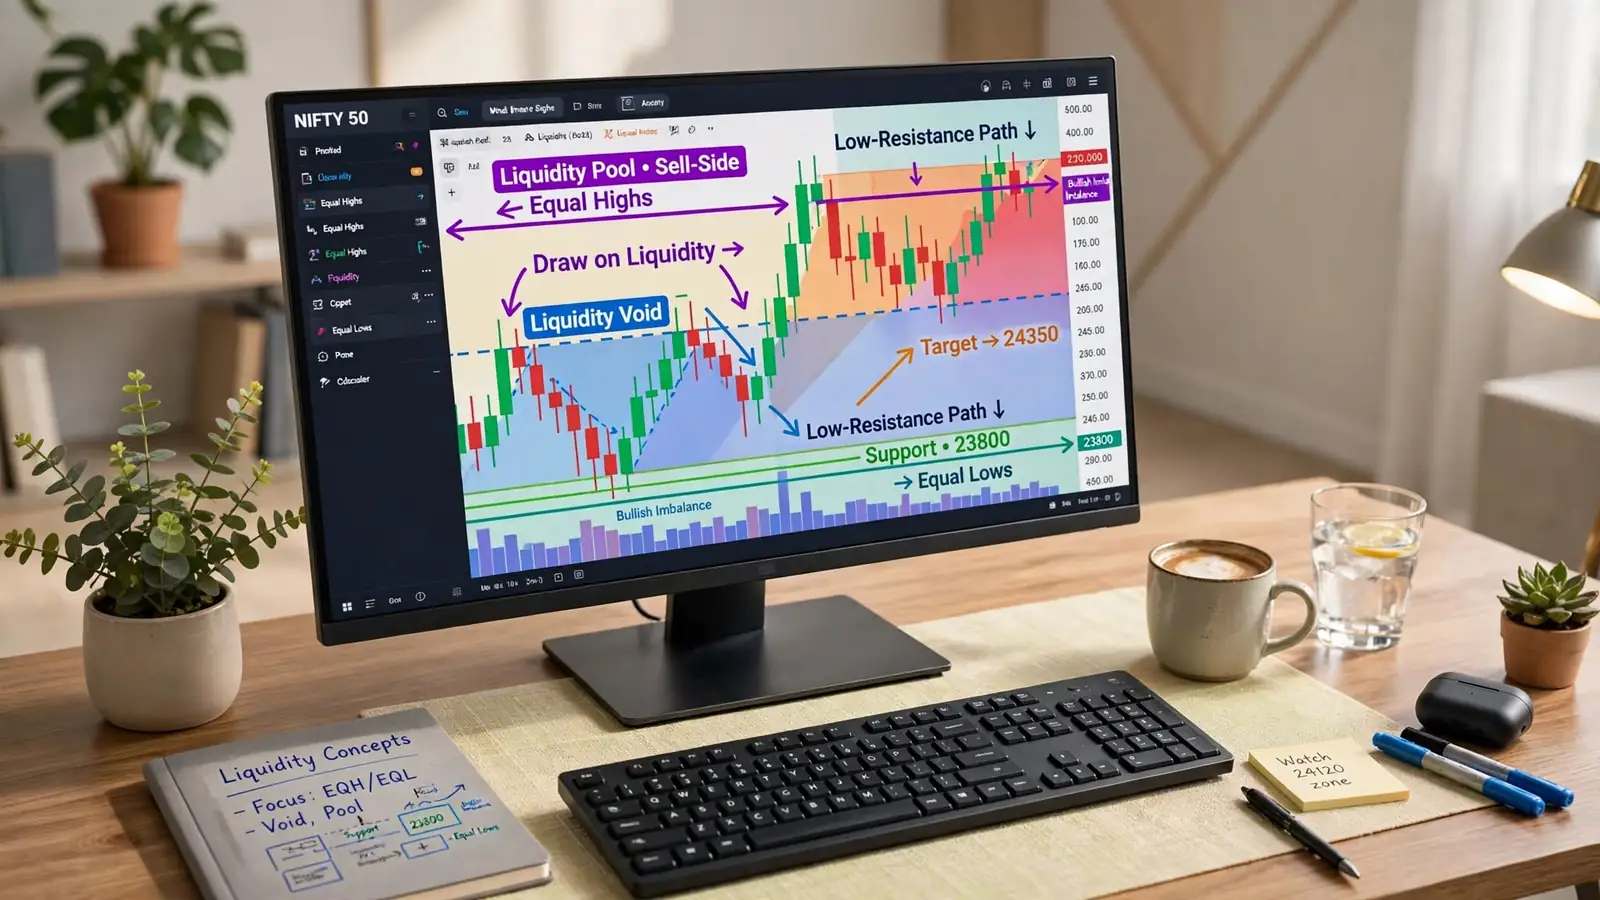
- Liquidity voids in the path. If the space between current price and the candidate draw contains a liquidity void — a stretch where price moved in one direction with almost no two-way trading, leaving a gap in the order book — that draw gets a ranking boost. Price tends to accelerate through a void rather than rotate inside it, because there is comparatively little resting order flow to absorb the move on the way through.
In our experience ranking these live, age and obviousness together explain most of the difference between a draw that gets hit cleanly and one that gets ignored. A fresh, obvious, unobstructed level beats an old, obscure, obstructed one almost every time we have charted the comparison.
Liquidity Voids and Low-Resistance Runs: Why Some Moves Accelerate
A low-resistance liquidity run is exactly what the name says: a move toward a draw that encounters almost nothing in its way — no dense order-book structure, no cluster of resting limit orders, no prior swing points to absorb momentum. Contrast that with a high-resistance run, where price has to fight through layer after layer of prior structure, each one capable of stalling or reversing the move. The practical tell for a low-resistance path is a liquidity void: a candle or run of candles with a large real body and comparatively thin wicks, printed on heavier-than-average volume, with little or no overlapping price action on either side of it once it has formed.
Why do voids accelerate moves instead of slowing them down? Per FINRA's investor education notes on market depth, a price level only resists further movement if there are resting orders sitting at it to transact against. A void, by definition, is a stretch where that resting liquidity was thin or absent when the move happened — so there is comparatively little left to absorb a subsequent push back through the same zone. Our team treats an unfilled void sitting directly between current price and a candidate draw as one of the strongest single arguments for picking that draw over a competing one, because the path itself is doing a meaningful share of the work.
This is also where our SMC Toolkit Pro earns its keep on the chart-reading side: the indicator flags qualifying liquidity voids and equal-high/equal-low clusters as non-repainting markers, so the ranking exercise above runs off objects that are already on the chart instead of being eyeballed from memory candle by candle. It is analytical software that speeds up structural reading — the judgment call on which draw outranks which is still the trader's, and every signal it plots should be paper traded first before any position sizing decision rides on it.
Choosing the Draw Before the Entry: A Worked Example
Here is the sequence we actually run, using a NIFTY intraday session as the walk-through. Assume price is at 24,180 shortly after the open.
- Step 1 — mark every candidate draw first, before looking at any entry signal. On this session that means: yesterday's high at 24,310 (obvious, untested since the prior close), an equal-highs cluster at 24,260 from two touches four sessions back, and a round number at 24,300 that sits almost on top of yesterday's high.
- Step 2 — rank them. 24,310 wins on three of four criteria: it is the most obvious level on the chart, it absorbs the nearby round number into the same zone (making it an even stronger confluence target), and the equal-highs cluster at 24,260 sits directly in its path, meaning a sweep of 24,260 can act as a stepping-stone toward 24,310 rather than a competing destination. 24,310 is the primary draw.
- Step 3 — check the path for voids. Between 24,180 and 24,260 the 15-minute chart shows two overlapping candles and a minor pullback — some resistance, not a clean void. Between 24,260 and 24,310 there is a thin, low-overlap stretch from an earlier session — a genuine low-resistance run once 24,260 clears.
- Step 4 — only now look for an entry. With the draw fixed at 24,310 and a two-stage path (resistance to 24,260, then a low-resistance run to 24,310), an entry only qualifies if its stop-to-target distance is cheap relative to that ~130-point total travel. An entry with a 40-point stop targeting the full 130-point draw gives roughly a 1:3.25 risk-reward — worth taking. An entry with an 80-point stop targeting the same draw gives roughly 1:1.6, which is a materially weaker trade on the same draw, even though the destination never changed.
Run the stop and target distances through Quantzee's risk-reward ratio calculator before sizing anything — the draw tells you where the trade could end, not whether the entry you found is cheap enough to justify getting there. See our risk-reward ratio glossary entry for how the ratio itself is calculated.
When Two Draws Conflict in Opposite Directions
The genuinely hard case is not picking a draw when there is one obvious winner — it is picking between two draws on opposite sides of price that both look legitimate. Say NIFTY sits at 24,180 with an untested sell-side pool at 24,050 (a prior session low, old and untouched for six sessions) and the buy-side draw at 24,310 described above. Both pass the basic criteria. In our experience, three tie-breakers resolve this more often than not:
- Higher-timeframe bias. If the 1-hour or daily structure is making higher highs and higher lows, the buy-side draw gets weighted up — not because sell-side liquidity stops existing, but because the broader trend context says sweeps against it are more likely to be absorbed than to reverse the larger structure.
- Recency of the last sweep. If sell-side liquidity near 24,050 was already partially swept two sessions ago and the reaction was a sharp rejection back up, that pool is now partly "spent" — some of the resting orders that made it attractive have already fired. The untouched buy-side draw at 24,310 outranks a pool that has already been dipped into once.
- Which side shows the cleaner void. When bias and recency are a wash, default to whichever direction has the actual low-resistance path — the void test from the section above — rather than guessing on narrative alone.
When all three tie-breakers genuinely split evenly, the honest answer is to stand aside rather than force a pick. A session with two equally weighted, opposite-direction draws is, by definition, a session where directional conviction is low — and that is informative on its own, not a gap to be filled with a coin-flip entry.
Partial-Target Logic: When the Draw Is Far Away
Not every session gives you a draw that is a clean, close-range run. Sometimes the top-ranked pool sits 200 or 300 points away on an index, well past where a single intraday position comfortably holds through the day's chop. Treating a distant draw as an all-or-nothing target is a common sizing mistake — the position either never gets there (most of the risk for none of the reward) or it does, but only after absorbing multiple rotations that would have stopped a tightly-managed position out on the way.
The fix is partial-target logic: break a distant draw into intermediate waypoints using the same ranking criteria, then scale exposure down (or take partial profit) at each waypoint rather than holding the full position for the final destination alone. In the worked example above, 24,260 served exactly this role — a legitimate intermediate pool that can be partially harvested before the position continues toward 24,310. Across the 60-session set our team tracked, trades that locked in a partial exit at a clearly ranked intermediate pool held up materially better on drawdown than trades that ignored the waypoint and ran the full distance on one unscaled position — even on sessions where the final draw was eventually reached. The intermediate pool does not need to be as strong as the primary draw to be worth respecting on the way there; it only needs to be real.
A Trade With No Identified Draw Is a Trade With No Target
Strip away the vocabulary and the core discipline here is simple: name the destination before you book the ticket. An entry pattern by itself — a fair value gap fill, an order block retest, a break of structure — tells you a reason to get in. It does not tell you how far the move can reasonably travel, and without that second piece, "risk-reward" is a number pulled out of the air rather than a number earned by measuring an actual, ranked destination. Methodology matters more than any single signal here: rank the candidate pools on age, obviousness, path clearance, and voids, resolve conflicts with higher-timeframe bias and sweep recency, break distant draws into waypoints, and only then ask whether the entry in front of you is cheap enough, in stop-to-target terms, to be worth taking.
Quantzee's SMC Toolkit Pro is built to speed up the mechanical half of that process — marking equal highs/lows, voids, and session extremes directly on the TradingView chart as non-repainting objects — so a trader's attention goes to the ranking and conflict-resolution judgment rather than to manually redrawing the same structures every session. It remains analytical software, not investment advice or a signal service, and nothing in this article or in the toolkit's output should be sized into live risk without paper trading the specific ranking rule a trader intends to use first.
Frequently Asked Questions
This article is educational and analytical in nature. Quantzee provides charting and analytical software for TradingView; it does not provide investment advice, and nothing here should be read as a recommendation to buy or sell any instrument. Paper trade any setting, threshold, or ranking rule discussed above before applying it to live capital.