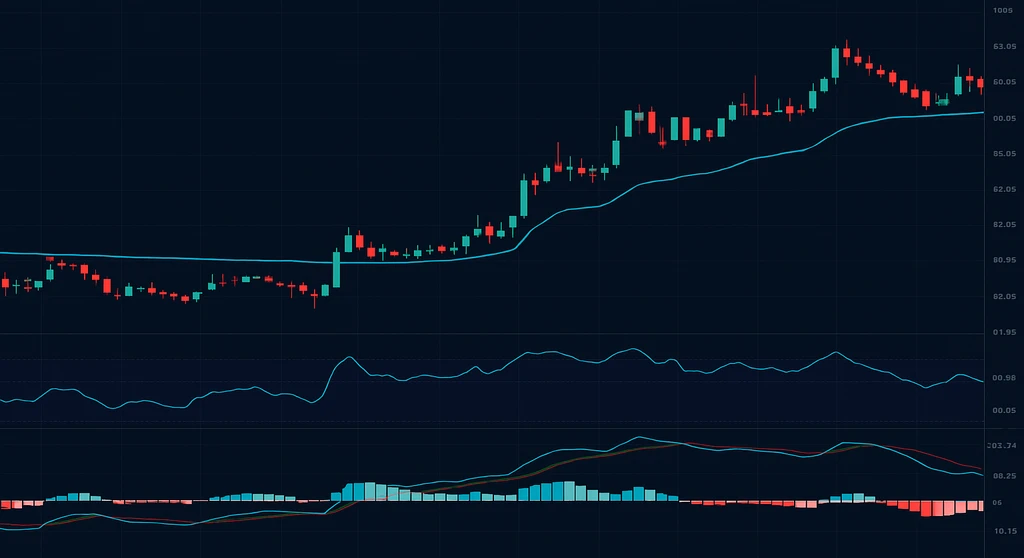
The short answer: The most effective day trading indicator setup in 2026 is three layers: VWAP to define intraday fair value and institutional reference, a trend tool (SuperTrend or EMA) to confirm direction, and a momentum oscillator (RSI or MACD) to time entries. Professional day traders consistently use two to four indicators — no more. Using more than four creates conflicting signals that slow your decision-making precisely when speed matters most.
This guide covers the full picture: what each major day trading indicator actually measures, the specific session dynamics that make intraday trading different from swing or position trading, how to combine indicators without overloading your chart, asset-specific setups for stocks, forex, and crypto, and how the new generation of AI-adaptive indicators on TradingView is outperforming static parameter approaches across volatile intraday conditions.
Disclaimer: All content is for educational and informational purposes only. Quantzee indicators are analytical software tools — not financial advice, investment recommendations, or guarantees of any trading result. Always apply your own risk management and do your own research before placing any trade.
Key Takeaways
- VWAP is the single most important intraday indicator for stock and equity futures day trading. It resets at the session open, reflects where institutional money has transacted, and functions as the primary reference line for professional traders.
- Non-repainting is the entry requirement for any indicator used in live intraday trading. A signal that disappears after the fact is worse than no signal — it creates false confidence and misleads your review of what happened.
- The optimal intraday setup is three tools: VWAP (intraday fair value) + trend filter (SuperTrend or EMA) + momentum oscillator (RSI or MACD). That three-layer stack covers what you need without conflicting signals.
- SuperTrend Pro+ is particularly effective for intraday use because its ATR-based dual-confirmation structure filters the whipsaws that plague single-line trend indicators during volatile opens and news-driven sessions.
- RSI Pro+ adds adaptive oversold/overbought bands and a divergence engine — the two most useful RSI upgrades for intraday traders who need levels that adjust to current session conditions rather than fixed 70/30 lines.
- MACD Pro+ adds a chop-zone filter that grades every cross as Strong or Weak — the most impactful upgrade for day traders, who face significantly more MACD whipsaws on 5-minute and 15-minute charts than swing traders on daily charts.
- The first 30 minutes after market open is the highest-volatility, highest-false-signal period on most markets. Many professional intraday traders pause indicator trading during this window, waiting for signals to stabilize around the 10:00–10:30 AM local time window.
What Is a Day Trading Indicator?
A day trading indicator is a mathematical formula applied to intraday price and volume data that produces a visual output — a line, histogram, arrow, or label — designed to help traders make faster, more structured decisions within a single trading session.
The defining constraint of day trading is time. A swing trader can wait three days for a setup to develop. A day trader on a 5-minute chart gets two or three bars, then the setup is either valid or it’s not. Indicators for intraday trading must produce signals quickly, be immediately interpretable, and — above all — not repaint after the fact, because a false historical signal in live intraday trading is a real-money loss.
What separates intraday indicator use from swing/position use:
- Session structure matters. Stocks have a defined open (9:30 AM ET in the US, 9:15 AM IST in India, 10:00 AM AEST in Australia) with predictable volatility patterns in the first and last 30 minutes. VWAP resets every morning. This session architecture creates specific indicator behaviors that do not exist in crypto’s 24/7 market or in daily swing charts.
- Shorter timeframes = more noise. The same RSI that gives clean signals on a daily chart generates three times as many false signals on a 5-minute chart. Every indicator needs different settings — often with shorter periods — to filter adequately on intraday timeframes.
- Volume is more immediate. Institutional order flow shows up immediately in volume data during a live intraday session, making volume indicators like VWAP particularly powerful for day traders.
- Commission and spread matter more. A day trader who takes 6–10 trades per day faces real cumulative cost. Indicators that generate more false signals cost real money — not just opportunity cost. Signal quality over signal quantity.
The Six Categories of Day Trading Indicators
1. Session Reference Indicators
Tools that define the intraday reference structure: where fair value is, where the session high/low and range are, what the key price levels to watch are. VWAP is the most important. These are used as context — not as buy/sell signals by themselves.
Examples: VWAP, Opening Range (first 5, 15, or 30 minutes high/low), Previous Day High/Low, Daily Pivot Points.
2. Trend Indicators
Define the current intraday directional bias. Are buyers or sellers in control during this session? Which direction should you be looking for trades?
Examples: SuperTrend, EMA (9/21/50), TEMA, Hull Moving Average.
3. Momentum Oscillators
Time entries within the trend. After you know direction (from the trend indicator), the oscillator tells you whether the move has room to run or is approaching exhaustion.
Examples: RSI, MACD, Stochastic, Williams %R, Rate of Change (ROC).
4. Volume Indicators
Confirm whether a move is backed by genuine buying or selling pressure. A breakout on low volume is a low-quality breakout; the same price action on high volume is significantly more reliable.
Examples: Relative Volume (RVOL), On-Balance Volume (OBV), Volume Profile, Money Flow Index (MFI).
5. Volatility Indicators
Define how large the typical intraday move is, which is critical for stop-loss placement. If a stock’s 5-minute ATR is $0.40, placing a stop $0.10 away is within normal noise and will be hit on almost every trade.
Examples: ATR (Average True Range), Bollinger Bands, Keltner Channels.
6. Pattern Recognition / Signal Indicators
Automated detection of specific setups — buy/sell arrows, divergences, structural breaks. These fire a specific entry signal and are the “output” that ties together the other layers.
Examples: SuperTrend Pro+ dual-confluence signals, RSI Pro+ divergence engine, MACD Pro+ strong-cross marker, AI Adaptive Quant Toolkit entry signals.
The Eight Core Day Trading Indicators Ranked
1. VWAP — The Most Important Intraday Reference
VWAP (Volume Weighted Average Price) is the average price an asset has traded at during the current session, weighted by volume at each price level. It resets at the open of every trading session and accumulates throughout the day.
Why VWAP matters more than any other indicator for day trading: Institutional traders — funds, desks, algorithms — use VWAP as their execution benchmark. They try to buy below VWAP (they’re getting better than average price) and sell above it (better than average). This institutional behavior creates genuine buying support below VWAP and genuine selling resistance above it. Technical analysis works best when large participants are acting on the same levels — and VWAP is the level that large participants genuinely use.
How to read VWAP for day trading:
- Price above VWAP: Buyers are in control for the session. Day traders should lean toward longs and be more skeptical of short setups until VWAP is lost.
- Price below VWAP: Sellers are in control for the session. Lean short. Any VWAP-retest rally that fails to reclaim VWAP is a short entry opportunity.
- VWAP reclaim: Price was below VWAP, then crosses back above it on volume. The reclaim — especially when accompanied by a MACD or RSI momentum shift — is one of the highest-probability long setups in day trading.
- VWAP rejection: Price rallies up to VWAP from below, gets rejected with a volume spike. One of the highest-probability short setups in trending bear sessions.
The VWAP bounce/reject setup (the most common professional intraday pattern):
- Identify the session bias (is the stock strong or weak relative to yesterday’s close and pre-market range?).
- Wait for price to pull back to VWAP after establishing a trend direction.
- Look for a reversal candle at VWAP with increasing volume.
- Entry when price resumes the original direction, confirmed by RSI turning in your favor.
- Stop placed below/above the VWAP reclaim candle. Target: prior high/low of the session or ATR-based.
Session VWAP vs Anchored VWAP: Session VWAP resets daily. Anchored VWAP (AVWAP) is pinned to a specific event — a major catalyst, a gap-down low, an earnings high. AVWAP gives context for multi-day intraday positioning. Both are available in VWAP Pro+ which adds session/week/month/custom anchoring, ±1σ/±2σ/±3σ bands for standard deviation levels, and a band-rejection reversion engine.
What VWAP does NOT do: VWAP does not tell you the direction of the next move — only where fair value currently is. Use a trend indicator alongside VWAP to get direction.
2. SuperTrend — The Cleanest Intraday Trend Filter
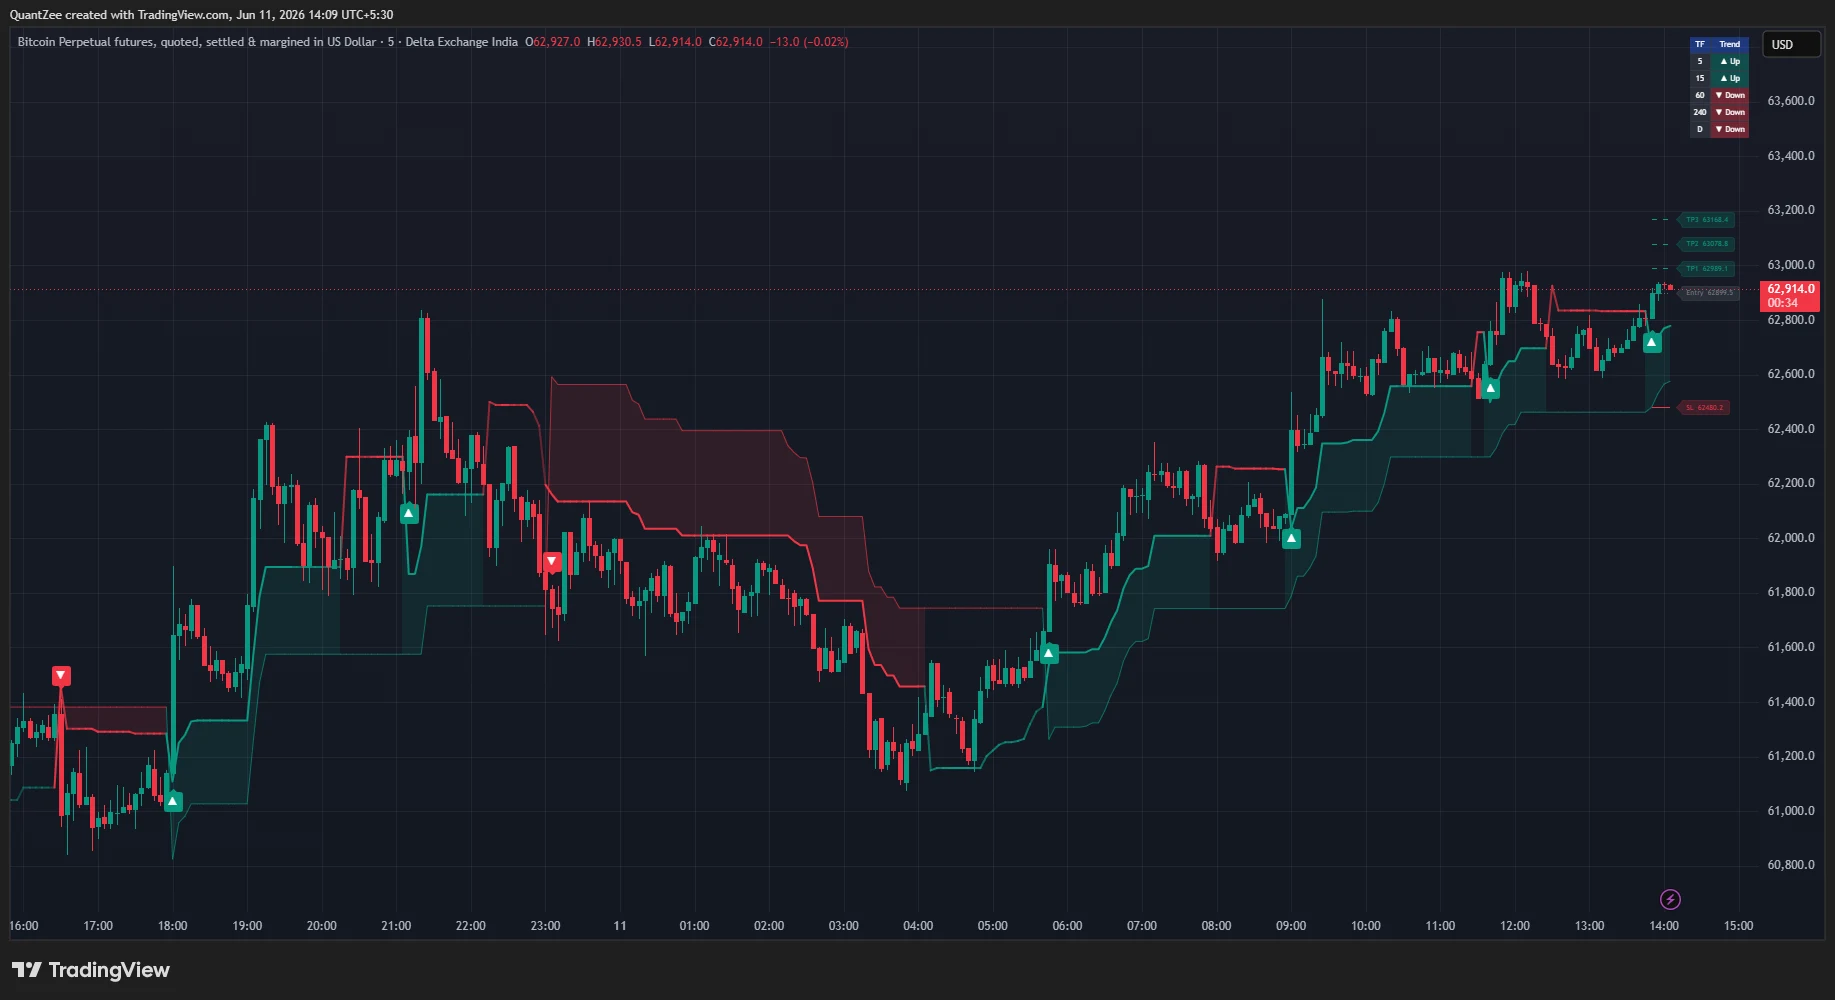
SuperTrend is an ATR-based indicator that plots a single line above or below price: below price (green) = uptrend; above price (red) = downtrend. When price crosses the band, it flips direction and generates a signal.
Why it works for intraday: SuperTrend uses ATR to size its bands, which means the band automatically widens during high-volatility periods (opening bell, news events) and narrows during low-volatility periods (midday lull). A simple EMA crossover will generate 10 false signals during a volatile 9:30–10:00 AM open on a stock with a 2% gap. SuperTrend’s volatility-adaptive bands absorb much of that noise.
Standard settings for intraday timeframes:
- 5-minute charts: ATR 10, Factor 2 or 2.5 (tighter for more responsive signals)
- 15-minute charts: ATR 10, Factor 3 (the standard default works well)
- 1-hour charts: ATR 10, Factor 3
The dual-confirmation advantage: The single most impactful upgrade to the standard SuperTrend for intraday trading is requiring two independent SuperTrend lines to agree before signaling — a slow line (higher ATR/factor) as a trend filter and a fast line (lower ATR/factor) as a signal trigger. This dramatically reduces the false flip signals that occur in choppy midday conditions.
SuperTrend Pro+ implements exactly this dual-confluence architecture: both the slow and fast SuperTrend must agree before a long or short signal prints. It also adds a three-level ATR profit target ladder (TP1/TP2/TP3) with a dynamic stop-loss that is particularly useful for day traders who need defined exit targets — not just entry signals. All signals are bar-close confirmed and never repaint.
Session-specific SuperTrend use:
- Morning session (first hour): Treat SuperTrend flips with skepticism until price has confirmed a direction with volume. Many professional intraday traders filter SuperTrend signals until after the first 15–30 minutes.
- Midday session: SuperTrend flips are often reliable trend-continuation signals when accompanied by a VWAP cross in the same direction.
- Closing session: Watch for SuperTrend to align with the day’s trend direction (not against it). Late-day reversals exist but are higher risk for new positions.
3. RSI (Relative Strength Index) — Momentum Timing
RSI measures the ratio of average gains to average losses over a defined period and produces a value between 0 and 100. Above 70 = traditionally overbought; below 30 = traditionally oversold.
How intraday RSI differs from swing RSI:
The standard RSI-14 on a 5-minute chart fires many more overbought/oversold signals than RSI-14 on a daily chart — because 14 five-minute bars covers 70 minutes of trading, which is about the range of a morning trend before the first pullback. Many day traders use RSI-9 on 5-minute charts to match the rhythm of shorter intraday moves.
Three ways intraday day traders use RSI:
-
VWAP + RSI entry timing: When price is above VWAP (bullish session) and RSI pulls back to 40–55 (retracing momentum without breaking down), then turns back up — this is the intraday momentum continuation setup. You have trend (VWAP control) and timing (RSI pullback/bounce).
-
RSI divergence for reversals: Price makes a new intraday low, but RSI makes a higher low — bullish divergence. On 15-minute charts, RSI divergences have a strong track record as intraday reversal signals around key VWAP and support levels.
-
RSI 50-line as trend filter: RSI above 50 = momentum-positive (favor longs). RSI below 50 = momentum-negative (favor shorts). Simple, fast, and reliable as a filter rather than a trading signal by itself.
The standard RSI problem for intraday: Fixed 70/30 thresholds were designed for daily charts. In a strong trending session on a 5-minute chart, RSI can stay above 70 for 40–60 consecutive bars during a gap-and-go momentum move. Treating every 70-touch as an overbought short signal would generate losses throughout the trend.
RSI Pro+ solves this with adaptive overbought/oversold bands: instead of fixed 70/30 lines, the bands are computed as rolling percentiles of the RSI’s own recent distribution (default: 90th and 10th percentile over 200 bars). In a strong uptrend, the overbought band automatically rises, reducing false “overbought” readings during trending intraday conditions. It also includes:
- Automatic divergence engine: Detects regular and hidden divergences with pivot-confirmed non-repainting signals — drawn directly on the RSI panel
- Multi-timeframe RSI dashboard: Shows RSI readings across five timeframes simultaneously, so you can check whether your 5-minute signal agrees with the 15-minute and 1-hour momentum without switching charts
- Six built-in alerts: Divergence alerts (regular and hidden, bullish and bearish) plus RSI exiting overbought/oversold — all bar-close confirmed
4. MACD (Moving Average Convergence Divergence) — Trend + Momentum
MACD shows the relationship between two exponential moving averages: the MACD line (12-period EMA minus 26-period EMA), the signal line (9-period EMA of the MACD line), and the histogram (the difference between them). Above zero = upward momentum; below zero = downward momentum. Signal line crossovers = potential trade signals.
Why MACD is particularly useful for day trading:
The MACD histogram’s bar-by-bar changes show momentum acceleration and deceleration before a crossover occurs. When the histogram starts shrinking (bars getting shorter in the same direction) while price is still making highs, that early divergence often precedes the crossover by 1–3 bars — giving a head start on positioning before the confirmed signal.
The intraday MACD problem — whipsaws on short timeframes:
On a 5-minute chart with default MACD settings (12/26/9), signal-line crossovers occur roughly every 30–90 minutes during active sessions. Many of these crosses occur in the “chop zone” — near the zero line where the MACD is oscillating without real directional conviction. These are the false-signal crosses that lose money even when the general direction is correct.
MACD Pro+ addresses this directly with its adaptive chop zone filter: a noise band sized from the standard deviation of the MACD’s own recent values is drawn around the zero line. Signal-line crosses inside this band are graded Weak (marked with a small grey ×) and treated as whipsaw-prone. Crosses outside the band are graded Strong (marked with a solid circle). This single feature reduces the false-cross problem that plagues standard MACD on 5-minute intraday charts.
Additional MACD Pro+ features relevant to day traders:
- 4-phase histogram coloring: Rising above zero / falling above zero / falling below zero / rising below zero — four distinct colors so momentum acceleration vs. deceleration is instantly visible before any crossover
- Divergence engine: Pivot-confirmed bullish and bearish divergences drawn on the MACD panel — bar-close confirmed, non-repainting
- Multi-timeframe MACD dashboard: Shows MACD status (above/below zero, above/below signal) across five timeframes — particularly useful for aligning 5-minute trade signals with 15-minute and 1-hour MACD regime
- Normalized mode: Expresses MACD as a percentage of price, making the indicator portable across different-priced instruments on your watchlist
MACD settings for intraday: Default 12/26/9 works on 15-minute and 1-hour charts. For 5-minute charts, some day traders use 6/13/4 for a faster-reacting MACD. The chop-zone filter in MACD Pro+ adjusts automatically to the symbol’s own volatility, making it useful across both settings.
5. Volume / Relative Volume (RVOL) — Confirming Conviction
Volume is the raw count of shares, contracts, or lots traded in each bar. Relative Volume (RVOL) compares current volume to the average volume for the same time of day across a lookback period. An RVOL of 2.0 means twice the normal volume for this time slot.
Why RVOL is more useful than raw volume for intraday trading:
Raw volume is misleading by itself because volume naturally varies throughout the session. The first 30 minutes always have high volume; midday always has low volume. RVOL normalizes for this, so an RVOL of 2.0 at 2:00 PM (normally a low-volume period) is a genuinely unusual signal — not an artifact of session timing.
How day traders use RVOL:
- Entry filter: Only take setups when RVOL is above 1.5 on the signal bar. Low RVOL moves tend to fail or reverse quickly.
- Breakout confirmation: A breakout above the opening range high on 3× average volume is far more reliable than the same price break on 0.5× average volume.
- News catalyst filter: Stocks with RVOL > 5 before 10:00 AM have a news catalyst driving unusual volume — these are often the best momentum day trading candidates but also the most volatile.
- Fading weak moves: A price push to a resistance level on below-average RVOL is a high-probability fade candidate.
6. Bollinger Bands — Volatility Context and Band Squeeze Setups
Bollinger Bands consist of a 20-period moving average with upper and lower bands at ±2 standard deviations. They expand when volatility rises and contract when volatility falls.
Intraday-specific Bollinger Band uses:
- Band squeeze setup: When the bands contract to their narrowest width of the session, a significant move is loading. The direction is not indicated — but the setup is pending. Watch for MACD or RSI to give direction cues when the squeeze fires.
- Opening range breakout confirmation: When price breaks the opening range and immediately pushes through the upper Bollinger Band on expanding volume, the breakout has genuine momentum. Band-contained breakout attempts are more likely to fail.
- %B overbought/oversold: %B above 1.0 (above upper band) signals overbought in a ranging session — a pullback toward the middle band is the expected mean-reversion. %B below 0 (below lower band) signals oversold. In trending sessions, price can walk the bands for extended periods.
- Band width for position sizing: Wider bands = more volatility = use smaller position sizes. ATR-based sizing can be proxied from Bollinger Band width when ATR is not displayed.
7. EMA (Exponential Moving Average) — Session Trend Confirmation
The 9 EMA, 21 EMA, and 50 EMA are the most common intraday EMAs used by day traders. The 9/21 EMA crossover on a 5-minute chart is one of the most widely used intraday trend signals.
Common intraday EMA setups:
- 9/21 EMA crossover: 9 EMA crosses above 21 EMA = short-term trend flipping bullish. Used as a directional filter alongside VWAP.
- EMA as dynamic support/resistance: In a trending session, price tends to pull back to the 9 or 21 EMA before resuming direction. These are entry points for trend continuation trades.
- 50 EMA on 5-minute: The 50-period EMA on a 5-minute chart represents roughly four hours of data — close to the full session. A stock holding above its 5-minute 50 EMA for most of the day is showing genuine intraday strength.
EMA vs SuperTrend for intraday: EMAs are simpler and faster-reacting but more susceptible to whipsaws in volatile sessions. SuperTrend’s ATR-based bands make it less prone to false reversals during high-volatility opens. Most professional intraday traders prefer SuperTrend as a trend filter and use EMA as a secondary confirmation rather than the primary signal.
8. ATR (Average True Range) — Stop-Loss Sizing
ATR measures the average price range per bar over a defined period. For intraday use, it is primarily a position sizing and stop-loss tool.
ATR-based stop-loss for day trading:
If a stock’s 5-minute ATR is $0.35, placing your stop 1× ATR ($0.35) below entry gives the trade enough room to breathe through normal intraday fluctuations without being stopped out by routine noise. A stop tighter than 0.5× ATR on a volatile stock will be hit by routine bar-to-bar movement on almost every trade, regardless of direction.
Why ATR matters more for day traders than swing traders: Intraday volatility can be two to four times higher during the first 30 minutes of session compared to midday. A fixed $0.50 stop is appropriately sized at 10:30 AM but too tight at 9:35 AM. ATR-based stops adjust automatically — tighter when the session is calm, wider when it is volatile.
ATR rule of thumb for US equity day trading:
- Stocks below $20: ATR typically $0.15–$0.50. Stop = 1–1.5× ATR.
- Stocks $20–$100: ATR typically $0.30–$2.00. Stop = 1× ATR.
- Large-cap stocks above $100: ATR $0.50–$5.00. Stop = 0.75–1× ATR.
The AI-Adaptive Alternative: One Tool That Does All Three Layers
Managing three separate indicators simultaneously — VWAP for reference, SuperTrend for trend, RSI or MACD for momentum — while also monitoring volume and managing an open position is the core operational challenge of intraday trading. Fast-moving markets do not wait for you to process four separate indicator panels.
The AI Adaptive Quant Toolkit was built for exactly this context. Its Autopilot engine continuously monitors current market volatility and self-tunes its sensitivity parameters in real time. During a high-volatility morning session (ATR expanding sharply after an earnings report), the Toolkit automatically widens its filters to avoid the cascade of false signals that fire on static-parameter indicators during volatile opens. During a calm midday session, it tightens to remain responsive to smaller moves.
For intraday trading specifically, the Toolkit operates in two relevant presets:
- Scalper preset (1–15 minute charts): Optimized for high-frequency intraday signals. Faster parameter cycling, tighter confluence requirements, optimized for capturing shorter momentum bursts.
- Trend Trader preset (15 minute–1 hour charts): Designed for slower, higher-conviction intraday trends. Wider bands, stricter dual-confirmation requirements, better performance during extended directional sessions.
The Toolkit’s Autopilot handles what would otherwise require constant manual parameter adjustment: when volatility spikes, it adapts. When it settles, it adapts. For a day trader who trades multiple instruments or multiple sessions, this self-calibration eliminates the need to maintain different saved indicator settings for different market conditions.
Available as part of the full Quantzee suite at $9.99/month with a 14-day money-back guarantee.
How to Build a Day Trading Indicator Stack
The Three-Layer Framework
| Layer | Function | Intraday Tool |
|---|---|---|
| Session reference | Where is fair value? What are key levels? | VWAP (session + anchored) |
| Trend filter | Which direction should I trade? | SuperTrend Pro+ or EMA 9/21 |
| Momentum timing | Is the move strong or exhausted? | RSI Pro+ or MACD Pro+ |
Add ATR as a fourth element for stop-loss sizing. Bollinger Bands or Relative Volume as optional fifth elements only if your strategy requires volatility context or volume confirmation.
The Four-Step Intraday Decision Process
Before entering any intraday trade:
Step 1 — Session orientation (first 5 minutes): Note where the session opened relative to VWAP. Is the stock/instrument above or below yesterday’s close? Is it gapping? A stock that gaps up and opens above VWAP is in a bullish session orientation. Structure your trading around that orientation.
Step 2 — Wait for the first 15–30 minutes (critical): The first 30 minutes after market open is the highest-volatility, most noise-prone period of any session. Institutional orders from the overnight and pre-market are being absorbed. Price can swing wildly above and below VWAP before establishing the day’s true direction. Many professional day traders do not take indicator signals during this window. Wait for the Opening Range (high and low of the first 15 or 30 minutes) to establish, then trade breakouts or pullbacks from that range.
Step 3 — Trend and momentum alignment: For any trade signal, check: (a) Is VWAP confirming the direction? (b) Is SuperTrend/EMA aligned? (c) Is RSI/MACD showing momentum in the same direction, not overextended? All three layers pointing the same way = highest-quality setup.
Step 4 — Volume confirmation: Is the RVOL above 1.5 on the setup bar? Is volume expanding in the direction of the move? A technically clean setup with below-average volume is a warning sign.
Session-Specific Day Trading Indicator Setups
US Equity Market Day Trading (NYSE/NASDAQ)
The US equity session (9:30–16:00 ET) has the most structure of any intraday market and the richest VWAP data.
Primary stack: VWAP + SuperTrend Pro+ on 5-minute chart + RSI Pro+ for momentum timing.
Key setups:
- VWAP Reclaim Long: Stock opens above VWAP, flushes below, consolidates, then reclaims. SuperTrend flips green on the reclaim bar. RSI crosses back above 50. Entry on the reclaim candle close. Stop below the flush low. Target: prior high + TP1 from SuperTrend Pro+ ATR ladder.
- Opening Range Breakout (ORB): First 15 minutes establish the range. Price breaks the opening range high with RVOL > 2. SuperTrend must be green. MACD must be crossing above zero. This is the classic momentum setup.
- VWAP Fade Short: Stock rallies into VWAP from below during a bearish session, gets rejected with a red candle on volume. RSI rolls below 50. MACD histogram turns red. Short entry on confirmation.
Session timing notes:
- 9:30–10:00 AM ET: Avoid or reduce size. Highest volatility, most false signals.
- 10:00–11:30 AM ET: Best window for trend setups. Momentum moves established, direction confirmed.
- 11:30 AM–1:30 PM ET: Lunch lull. Low volume, more MACD and RSI false signals. Reduce trading.
- 1:30–3:30 PM ET: Afternoon momentum resumes. Sometimes reversal of morning trend.
- 3:30–4:00 PM ET: Institutional closing flows. Price can reverse sharply. Close intraday positions.
Indian Market Intraday (NSE/BSE — NIFTY/BankNIFTY)
The NSE session (9:15–15:30 IST) has its own distinct rhythm driven by F&O expiry dynamics and RBI/FII flows. See our complete guide: Best Intraday Indicators for Indian Stock Market.
Primary stack: VWAP + SuperTrend Pro+ on 5-minute NIFTY chart + CPR ThetaEdge for intraday pivot levels + RSI Pro+.
Key intraday characteristics:
- 9:15–9:45 AM IST is the most volatile window — comparable to the US opening bell but compressed. Many experienced NIFTY traders wait for the first 30 minutes to pass before entering.
- Thursday weekly expiry sessions have extreme volatility in F&O (options decay to zero creates large intraday swings in premium). Adjust position size down on expiry Thursdays.
- SEBI regulations govern intraday trading, F&O use, and algorithmic trading in India. Quantzee indicators are analytical software tools providing chart signals — they are not automated trading systems and do not constitute financial advice. Always comply with the current SEBI framework for your trading activity.
CPR (Central Pivot Range): CPR is a pivot-point system particularly popular among Indian intraday traders. It defines the day’s value area before the market opens, based on the previous day’s high, low, and close. CPR ThetaEdge (/indicators/cpr-theta-edge/) implements CPR on TradingView with automatic level calculation and alerts.
Forex Intraday Trading (EUR/USD, GBP/USD, etc.)
Forex trades 24 hours per day but has distinct high-volume sessions: London (08:00–16:00 GMT) and New York (13:00–22:00 GMT). The London/NY overlap (13:00–16:00 GMT) is the highest-volume, most technically reliable window for forex intraday trading.
Primary stack for forex intraday: SuperTrend Pro+ on 15-minute chart + MACD Pro+ for trend + momentum timing + RSI Pro+ for divergence detection.
Forex-specific notes:
- VWAP is less meaningful for forex because the market is 24/7 with no genuine single open point. Session VWAP reset at 00:00 UTC gives some reference, but many forex traders prefer Anchored VWAP anchored to the London open.
- MACD Pro+ is particularly useful on forex because the chop-zone filter grades crosses that occur during low-liquidity periods (Asian session) as Weak, avoiding the false signals that fire when EUR/USD drifts during low-volume overnight hours.
- Spread costs matter more for forex day traders than equity traders. High-frequency 5-minute setups on pairs with 2–3 pip spreads need a wider profit target to overcome the round-trip cost.
Crypto Intraday Trading
Crypto’s 24/7 nature and extreme volatility regimes create specific challenges for day trading indicators. See our complete guide: Crypto Trading Indicators: The Complete 2026 Guide.
Primary stack for crypto intraday: AI Adaptive Quant Toolkit in Scalper preset + VWAP anchored to prior day’s close + RSI-9 on 15-minute chart.
Why the Toolkit is the preferred single tool for crypto day trading: Crypto volatility can shift dramatically within a single session — from a calm Asian-session drift to a violent US-session expansion on macro news. Static indicator parameters that work at 02:00 UTC generate excessive false signals at 14:00 UTC. The Toolkit’s Autopilot adjusts automatically, making it the most practical choice for traders who cannot manually re-tune settings across multiple crypto sessions.
The Most Common Day Trading Indicator Mistakes
1. Trading the Opening Bell With Full Position Size
The first 15–30 minutes of any equity session is a different market than the rest of the day. Orders from the overnight queue are being absorbed. Gaps are being filled or confirmed. True direction is not yet established. Indicator signals during this window have significantly higher false-signal rates than the same signals two hours later.
Fix: Reduce position size or use a strict confirmation filter (e.g., three consecutive bars closing in the direction of the signal) during the first 30 minutes. Many professionals sit out completely and enter only after 10:00 AM ET/10:15 AM IST.
2. Using Standard RSI 70/30 on 5-Minute Charts
Fixed 70/30 thresholds on short timeframes produce too many “overbought” readings during trending intraday moves. A stock gapping up 5% and trending throughout the morning will hold RSI above 70 for the entire session. Treating every RSI-70 touch as an overbought short signal during this kind of move is a losing strategy.
Fix: Use adaptive bands (RSI Pro+) that adjust to the current momentum regime, or use RSI primarily for divergences and the 50-line filter rather than static overbought/oversold thresholds.
3. Treating Every MACD Crossover as a Trade Signal
On 5-minute charts with default MACD settings, signal-line crossovers can fire 8–15 times per session. Most occur in the chop zone near the zero line where the MACD is oscillating without directional conviction. Trading every crossover is a commission machine, not a strategy.
Fix: Use MACD Pro+‘s chop-zone grading (Strong vs Weak crosses) or add a zero-line filter (only trade crossovers that occur at least X standard deviations from zero). Only act on crosses that have real displacement from equilibrium.
4. Ignoring Volume
A SuperTrend flip or an RSI bounce on below-average RVOL is a low-quality signal. Institutional participation — which gives signals their predictive power — does not show up in low-volume moves.
Fix: Always cross-reference your indicator signal with RVOL. Require RVOL > 1.5 on the signal bar for any breakout or trend-continuation setup.
5. Moving Stops to Break-Even Too Early
Many intraday traders move stops to break-even immediately after entry, which causes them to be stopped out on the first normal pullback — then watch the original signal continue in their direction without them. Break-even stops placed too early negate the edge of a technically sound setup.
Fix: Give the trade at least 1× ATR of breathing room before moving the stop. SuperTrend Pro+‘s ATR-based TP1/TP2/TP3 ladder provides natural exit levels that avoid the premature stop problem — only tighten the stop after TP1 is hit.
6. Overloading the Chart
Six indicators on an intraday chart produce slower decisions, not better ones. Every additional panel you add is something your eye must process before acting. At 9:45 AM on a fast-moving stock, the extra two seconds you spend reading a sixth indicator can mean a 0.3% worse fill.
Fix: Max four indicator panels for active day trading. VWAP + trend + momentum + volume is a complete framework. Everything else is noise.
Free vs Paid Day Trading Indicators on TradingView
| Feature | Free Community Indicators | Quantzee Premium Suite |
|---|---|---|
| Non-repainting verified | Rarely — often repaints | Yes — bar-close confirmed, non-repainting by design |
| Adaptive parameters | Static only | AI Autopilot self-tunes to current volatility |
| Chop-zone MACD filter | Not available | MACD Pro+ Strong/Weak cross grading |
| Adaptive RSI bands | Fixed 70/30 only | RSI Pro+ adaptive percentile bands |
| Divergence engine | Manual only | RSI Pro+ + MACD Pro+ auto-detect, non-repainting |
| Multi-timeframe dashboard | Separate indicators | RSI Pro+ + MACD Pro+ built-in MTF table |
| ATR profit target ladders | Not available | SuperTrend Pro+ TP1/TP2/TP3 |
| Alerts | Basic | Full alert suite, bar-close confirmed |
| Price | Free | $9.99/month |
The core value of Quantzee’s suite for day traders is not the indicator category — any TradingView indicator library has RSI, MACD, and SuperTrend. The value is the non-repainting architecture (signals mean what they say), the chop-zone and adaptive-band upgrades that directly address the intraday false-signal problem, and the multi-timeframe dashboards that let you check higher-timeframe alignment without switching charts.
Verifying Any Intraday Indicator Before You Trust It
Step 1: Non-repainting test (Bar Replay). Open TradingView’s Bar Replay on a chart from 30 days ago. Step through bars one at a time. Note every signal that appears. Advance one bar and look back. If any signal that appeared on bar N is now gone or moved on bar N+1 — the indicator repaints. Stop. For a full test methodology, see: How to Test Any TradingView Indicator for Repainting.
Step 2: False-signal count in a choppy session. Find a choppy sideways session in your chart history (look for a midday lull with volume below 0.8× average). Count how many signals fired and how many were false. If the indicator fires more than 4–5 times in a two-hour midday window and most are false, it will drain your account in live trading.
Step 3: Backtesting across session types. Test the indicator across at least three distinct session types: a strong trending day (1% directional move), a choppy ranging day, and a high-volatility news-driven day. If it only performs well on trending days, it is not a complete day trading tool. For the full backtesting methodology: How to Backtest a TradingView Indicator.
Step 4: Live forward-test with minimum position. Before using full size, forward-test the setup with your minimum position for at least 20 trading sessions. Record every signal, every entry, every exit. After 20 sessions you have enough sample to assess whether the results match the backtest expectation.
Frequently Asked Questions
Conclusion: Day Trading Indicators as a Systematic Framework
The goal of using day trading indicators is not to find a system that never loses. Every systematic approach to intraday trading has losing days, losing streaks, and sessions where every setup fails. The goal is a framework that produces consistent positive expectancy over enough trades — more winners than losers, or smaller losses than wins — while defining exactly where you are wrong before you enter.
The framework for 2026:
- VWAP as your session reference — defines the intraday bias and the key reclaim/reject levels
- SuperTrend Pro+ as your trend filter — dual-confirmation, non-repainting, with built-in ATR exit targets
- RSI Pro+ or MACD Pro+ for momentum timing — adaptive bands and chop-zone filtering address the specific false-signal problems that plague standard indicators on short timeframes
- AI Adaptive Quant Toolkit as a single-tool alternative — self-tuning Autopilot handles the parameter calibration that would otherwise require constant manual adjustment
Apply these tools with session-structure awareness: respect the first-30-minute volatility window, respect the midday lull, size based on ATR rather than fixed dollar amounts, and verify every indicator you use with Bar Replay before trusting it in live trading.
All 13 Quantzee indicators — including SuperTrend Pro+, RSI Pro+, MACD Pro+, and AI Adaptive Quant Toolkit — are available at $9.99/month with a 14-day money-back guarantee.
Related Reading
- Best Intraday Indicators for Indian Stock Market
- Best Indicators for Day Trading in Australia
- Best Scalping Indicator for TradingView 2026
- Best Buy Sell Indicator for TradingView 2026
- How to Backtest a TradingView Indicator (Complete Guide)
- Crypto Trading Indicators: The Complete 2026 Guide
- The Complete Guide to Trading Indicators and Signals
- Non-Repainting TradingView Indicators: The Complete Guide
Authority References
- Warrior Trading: Best Indicators for Day Trading — Professional day trader perspective on VWAP, RVOL, and momentum indicators.
- Investopedia: VWAP — Canonical VWAP definition and institutional use as an execution benchmark.
- Investopedia: MACD — MACD components, calculation, and interpretation.
- Investopedia: RSI — RSI formula, standard thresholds, divergence explanation.
- Investopedia: Average True Range — ATR calculation and stop-loss sizing applications.
- TradingView Pine Script: Repainting — Technical explanation of repainting causes in TradingView indicators.
- SEBI: Algorithmic Trading Framework — India’s regulatory framework for algorithmic and automated trading.
Educational Disclaimer: All content in this article is for informational and educational purposes only. Quantzee indicators are analytical software tools for chart analysis — they are not financial advice, investment recommendations, or guarantees of any trading result. Past signal performance does not predict future market outcomes. Day trading involves significant risk of loss. Always conduct your own research, apply your own risk management, and consult a qualified financial adviser before committing capital. In India, comply with the current SEBI framework before engaging in any algorithmic or intraday trading activity.