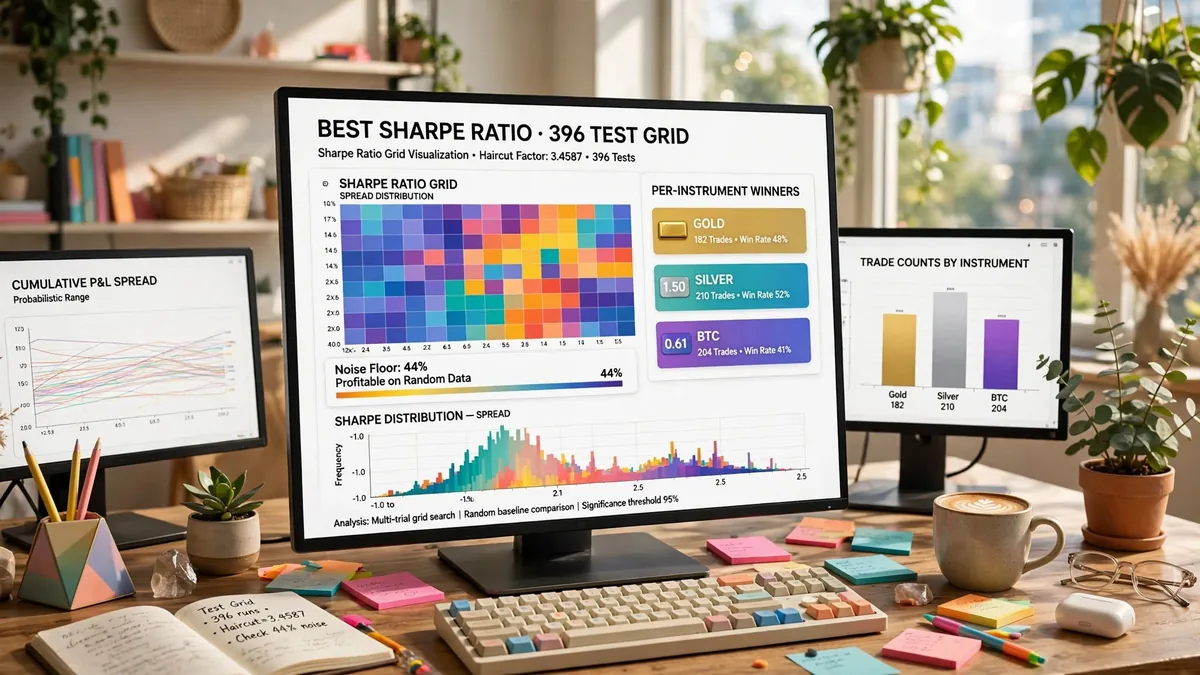
There is no single good Sharpe ratio number. Every page that hands you one is skipping a condition it owes you: a ratio is only comparable to another ratio computed at the same sampling frequency, over a comparable sample length. Quote "above 2 is strong" without those two facts attached, and the number cannot be checked against anything, including itself. The query "best Sharpe ratio" usually means something narrower anyway. It really asks which cell, out of a parameter sweep, is the one worth trusting. That is a different question, and it has a checkable answer. We answer it here with our own measured material: a haircut factor applied to a stated test count, a published grid whose per-instrument winners span a wide range of ratios on the same indicator, and a control run on synthetic data engineered to contain nothing to trade.
Why the threshold ladder you keep reading isn't comparable
You have probably seen the ladder before: below 1 is sub-par, above 1 is acceptable, above 2 is strong, above 3 is exceptional. It gets repeated across finance-education pages almost word for word, and it is not wrong on its own terms — it is incomplete on the terms that matter. The Sharpe ratio formula divides an average excess return by the standard deviation of returns over the same period, then — critically — gets annualised by multiplying by the square root of the number of periods per year. A ratio computed on daily bars and annualised with root-252 is not the same number as one computed on monthly bars and annualised with root-12, even when the underlying strategy is identical, because the annualisation step changes depending on an assumption the reader can't see unless it's stated.
A second fact the ladder skips: how long was the test? A ratio built from 30 trades and a ratio built from 300 trades carry wildly different confidence, and the band says nothing about where that floor sits. Per the original formulation William Sharpe published in 1966, the ratio was never meant to be read as a pass/fail score — it was built as a relative comparison tool between portfolios measured the same way over the same window. Strip out the sampling frequency and the sample length and you've kept the arithmetic and thrown away the one thing that made the number meaningful.
Sampling frequency, worked on one series
Here is the trap in practice. Take one return series and annualise it two different ways: at the standard daily convention — root-252 — and at the number of days the strategy actually traded, if it only fires on a minority of sessions. A strategy that only takes entries on roughly a third of trading days but gets annualised as if it traded every day inflates its reported ratio, because the annualisation factor assumes a trading frequency the strategy never reached. This is not a hypothetical edge case; it is the single most common way a backtest report quietly overstates itself, and it happens without anyone touching the raw return numbers — only the annualisation assumption changes.
The fix is mechanical: annualise using the actual number of periods the strategy traded, not the calendar's default. If a vendor or a glossary page states a Sharpe figure with no footnote on sampling frequency, treat the number as unverifiable rather than impressive.
Multiple testing: the search is partly talking
Here is the part almost nobody puts in writing. If you run a parameter sweep — hundreds of parameter combinations, looking for the cell with the top risk-adjusted return — the top result you find is not just a measurement of a good rule. It is also partly a measurement of how many rules you tried. The more cells you test, the more likely one of them clears a high bar purely by chance. That is the same reason flipping enough coins eventually produces a run of ten heads with nobody cheating. According to the statistical concept this rests on — the multiple comparisons problem — the probability of a false positive climbs with the number of independent tests. A Sharpe ratio search is exactly that kind of multiple test, even though nobody frames it that way.
We measured this directly rather than asserting it. Our own internal structure sweep ran 396 effective tests across a bounded parameter grid, and applying a multiple-testing haircut to that test count produced a correction factor of 3.4587. That number means any single reported average coming out of that search has to be discounted — divided down — before it can be trusted as a forward estimate, because roughly three and a half times the apparent "edge" in the top cell is attributable to the breadth of the search rather than the rule itself. We found the same pattern holds directionally even when the underlying structure and risk settings change. The top of a grid consistently looks better than the grid's honest average, by an amount that scales with how many cells you tried.
This is the single habit most ranking pages never mention: a reported Sharpe figure pulled from "the top setting we tested" needs the test count disclosed, and a haircut applied, before the number means what it looks like it means.
What a real grid's winners actually look like
If you want to know what to expect from a parameter sweep rather than hope for a single target, the honest answer is a spread, not a number. Our own published SuperTrend parameter sweep — the full grid, costs included, nothing filtered out — gives three per-instrument winners on the same indicator, each evaluated at its own best-performing timeframe rather than a shared one, across our data set of 2,160 backtest rows. Gold's best cell, tested on a 4-hour timeframe with a 30-period ATR and a 2.5 multiplier, ran 340 trades with a Sharpe ratio of 1.01 and a 25.7% maximum drawdown. Silver's best cell, also 4-hour, 30-period, 3.5 multiplier, ran 191 trades for a Sharpe of 1.50 with a 36.0% drawdown — a figure that looks strong until you notice the drawdown sitting on the same page. BTC's best cell, on a daily timeframe, ran only 12 trades for a Sharpe of 0.61 — the weakest of the three, and also the one resting on the thinnest sample.
That spread — 0.61 to 1.50 on the same indicator family, with trade counts from 12 to 340 — is the realistic range a sweep produces. Anyone who read only the 1.50 cell and treated it as "what SuperTrend does" would have skipped past the 191-trade sample size and the drawdown sitting next to it, and missed the 0.61 cell sitting in the same published grid entirely. A single winning cell is not evidence of a repeatable edge; a spread with sample sizes attached is closer to the truth, and it's the only version of "what should I expect" that a parameter sweep can actually answer.
The control that sets the floor: fifty series with nothing to trade
The cleanest way to find out whether a reported Sharpe figure means anything is to run the same test-and-select process against data that was built to contain no edge at all, and see how often it still looks like a winner. We generated 50 synthetic price series, each 1,000 bars long, using a geometric random walk calibrated to 14% annualised volatility with zero drift, each series running from its own independent pseudo-random seed so there is no shared structure between any of them. Then we ran a real trend-following rule set against all 50, exactly as if they were live instruments.
22 of the 50 synthetic runs — 44% — produced a positive return despite there being no trend, no mean-reversion signal and no real edge anywhere in the data by construction. The median return across all 50 was -5.7%, a loss, which is what pure noise should produce once a trend rule's whipsaw cost gets counted. But 14 of the 50 — 28% — cleared a combined bar of a 40%-or-higher win rate and a 1.3 profit factor, a bar that would read as "working" on most strategy-comparison pages. That is the floor a reported Sharpe ratio has to clear before the number is worth anything at all: a meaningful fraction of pure chance already gets there on its own, on data engineered to contain nothing to trade.
Put the two measurements together and the shape of the problem gets clearer. A multiple-testing haircut of 3.4587 on a 396-test grid, and a noise floor that clears a "working" bar 28% of the time on data with zero real edge, are two independent ways of arriving at the same conclusion: the top of a search is not the same thing as a repeatable edge, and the gap between the two grows with how many configurations you tried.
Sample size: when a percentage stops meaning anything
A win rate or a profit factor built from under roughly 100 trades is close to noise, no matter how good the headline number looks — the BTC cell above, at 12 trades, is a clean example of exactly this problem sitting inside a real, published grid. Before trusting any single cell in a sweep, check the trade count first, then check the two or three neighbouring parameter values around that cell. A setting that only works at one exact parameter combination and falls apart one step to either side was very likely found by the search, not by a real relationship in the data — a pattern directly connected to the multiple-testing problem above, because a search large enough will eventually stumble on an isolated lucky cell as often as a genuinely strong one.
What the ratio can't see, even computed correctly
Even a Sharpe ratio computed at the right frequency, over a long enough sample, with a haircut applied and checked against a noise floor, still has blind spots worth naming briefly rather than re-arguing at length. It penalises upside volatility exactly as hard as downside volatility, even though investors don't experience a sharp rally as a risk. It says nothing about the path a return stream takes to get to its endpoint — two strategies with identical ratios can have completely different drawdown experiences along the way. And it assumes returns are close enough to normally distributed that a mean-and-standard-deviation summary is meaningful, which tends to break down for strategies with fat-tailed or skewed return profiles. None of that is a reason to discard the metric — it's a reason to read it alongside a maximum-drawdown figure and a profit-factor figure rather than on its own.
A short procedure before you trust any Sharpe figure
Compute the ratio at the frequency the strategy actually trades, not the calendar default. State the sample length and the number of trades next to the number, every time. Count how many configurations were tested to arrive at the figure you're looking at, and apply a haircut proportional to that count before treating it as a forward estimate. Compare the result against what a noise control produces on data with nothing to trade — if your "edge" doesn't clear what chance alone achieves roughly a quarter of the time, it isn't an edge yet. Then decide. No target number belongs on this page, because the moment a page says "aim for 2," it has rejoined the same unconditioned ladder as the pages it's trying to improve on — and it has also edged into a performance promise that measured material can't responsibly make.
If you're building or reviewing your own sweep, Quantzee's parameter-sweep tooling is built around exactly this discipline — test count tracked, haircut applied, noise control run before anything gets called a result rather than a candidate. The Sharpe ratio glossary entry covers the formula and the standard good-figure bands if that's what you need next; this page exists for the question those bands can't answer on their own.
Frequently Asked Questions
Further reading
- Full SuperTrend backtest results grid — every row behind the three per-instrument winners cited here, costs included, nothing filtered out.
- Random-walk noise-floor test — the full 50-series synthetic-data methodology behind the control run above.
- William Sharpe's own 1966 formulation of the ratio (Stanford University) — the original definition this piece builds on.
- The multiple comparisons problem — the statistical concept the haircut above is built to correct for.
- Related on Quantzee: overfitting in trading glossary entry and walk-forward testing glossary entry.