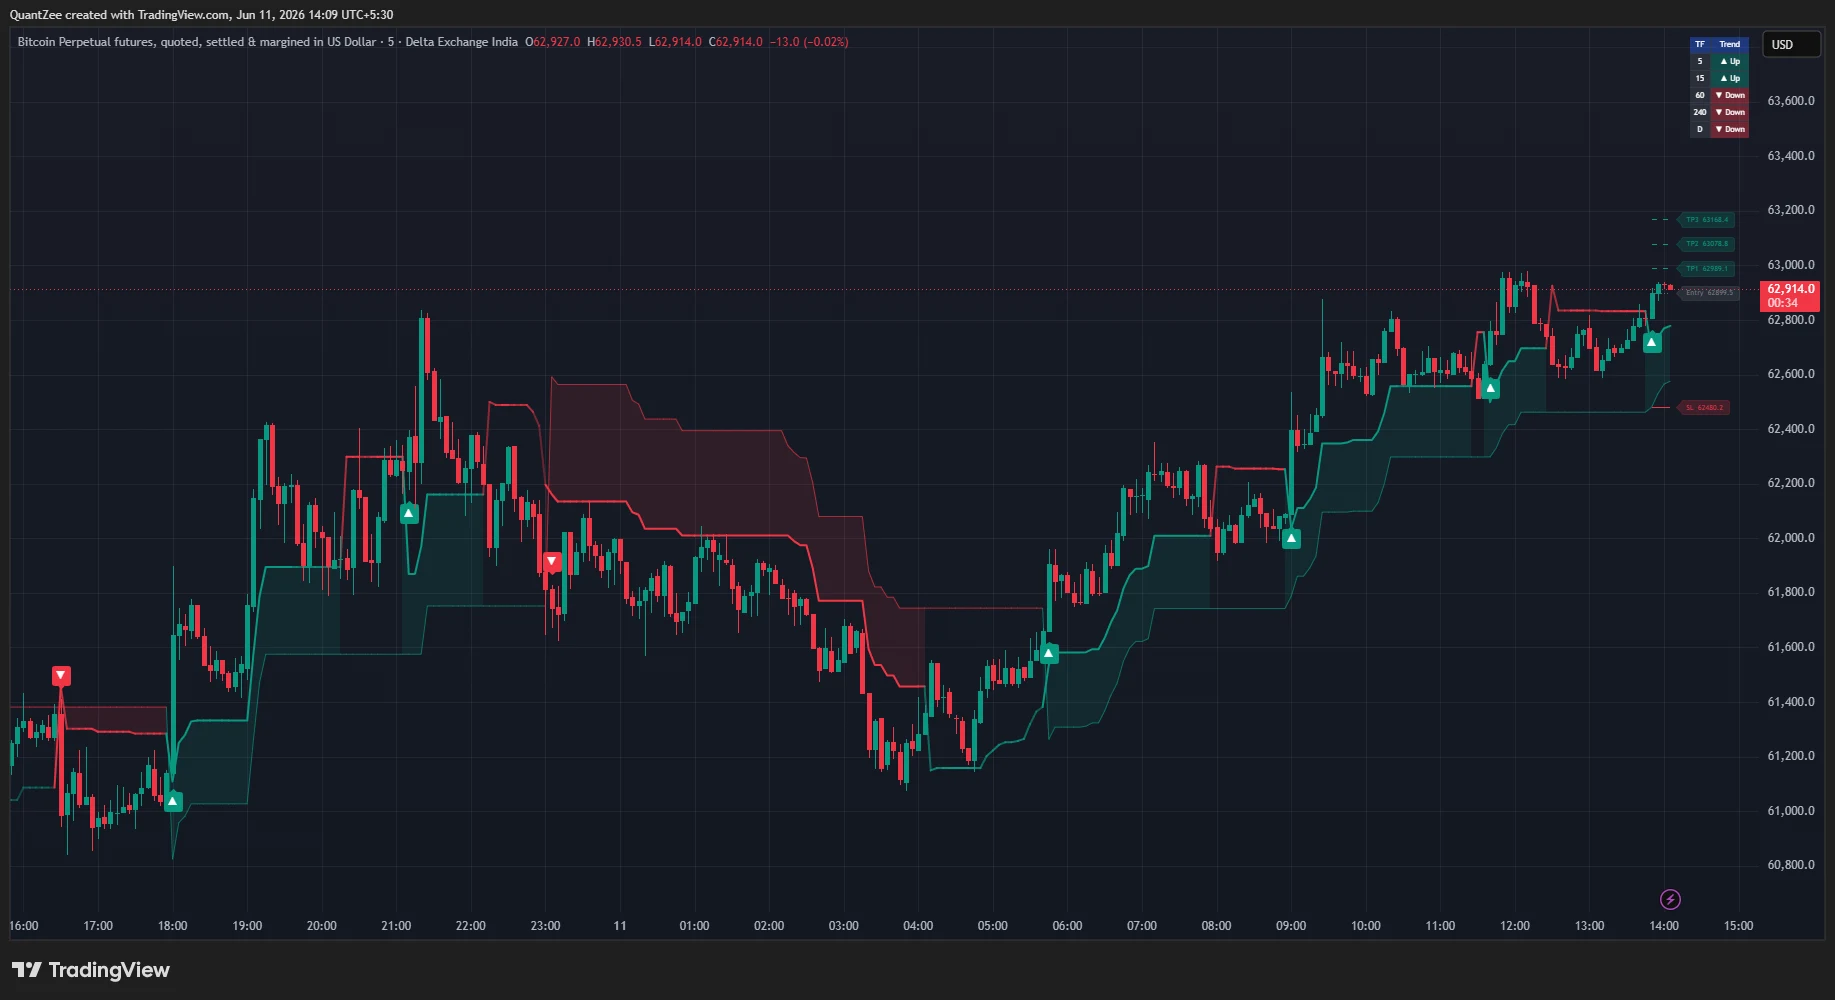
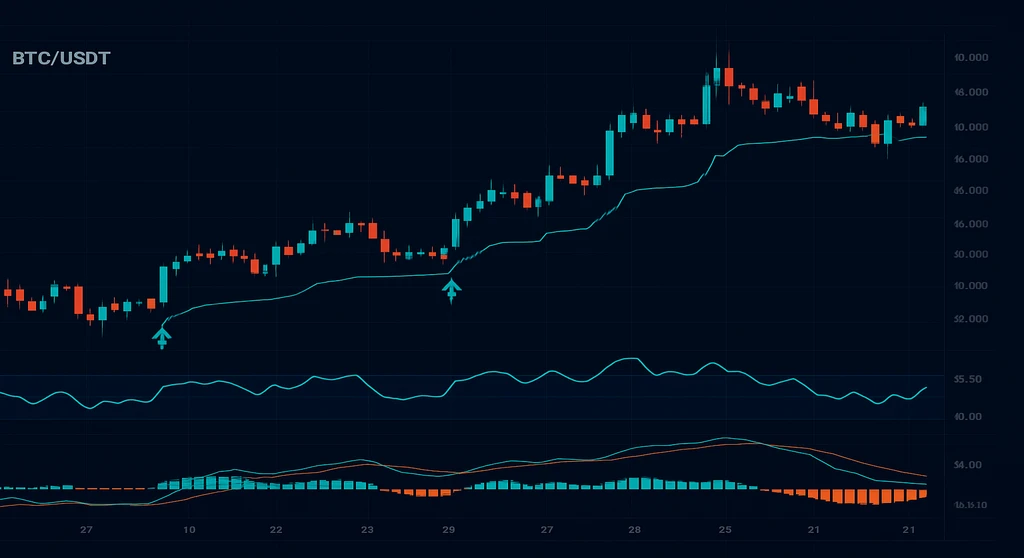
The short answer: The most effective crypto trading setup in 2026 uses three indicator layers — a trend indicator to define direction (SuperTrend, EMA), a momentum oscillator to time entries (RSI, MACD), and a volume tool to confirm conviction (OBV, VWAP). The mistake most traders make is using more than four indicators at once, overlapping tools that measure the same thing, and applying stock-market default settings to assets that trade 24 hours a day, 7 days a week.
This guide covers the complete picture: what every major category of crypto indicator actually measures, how to read each one, the specific settings that work better for crypto vs traditional markets, how to stack indicators without creating “analysis paralysis,” and why the new generation of AI-adaptive indicators is outperforming static approaches on volatile assets like Bitcoin, Ethereum, and high-cap altcoins.
Disclaimer: All content is for educational and informational purposes only. Quantzee indicators are analytical software tools — not financial advice, investment recommendations, or guarantees of any trading result. Crypto markets are highly volatile. Always apply your own risk management and do your own research before placing any trade.
Key Takeaways
- Crypto requires different indicator settings than stocks — assets trading 24/7 with extreme volatility regimes need shorter periods and wider bands than traditional finance defaults.
- The optimal setup is three layers: trend + momentum + volume. Every additional indicator past four adds noise, not signal.
- Non-repainting is the only criterion that matters before you trust any buy/sell signal. A repainting indicator always looks great on the historical chart and fails in live trading.
- SuperTrend-based indicators outperform simple EMA crossovers on crypto because ATR-based bands adapt to volatility regime shifts automatically.
- AI-adaptive indicators (like Quantzee’s AI Adaptive Quant Toolkit) that self-tune to changing volatility are particularly valuable on crypto’s 24/7 markets where no single static setting works across all sessions.
- The same indicator behaves differently on BTC/USDT (high liquidity, smooth signals) vs low-cap altcoins (thin order books, more false signals). Match your indicator to your asset.
What Is a Crypto Trading Indicator?
A crypto trading indicator is a mathematical formula applied to price, volume, or time data that produces a signal or visual output on a chart. Unlike fundamental analysis (which examines a project’s team, tokenomics, or network activity), technical indicators operate entirely on price and volume data — they make no claim about intrinsic value.
The key concept: indicators do not predict the future. They describe the current market state in a more structured way than looking at raw candlesticks. A trend indicator tells you which direction price has been moving and whether that movement is accelerating or decelerating. A momentum indicator tells you how fast price is moving and whether that pace is extreme (suggesting exhaustion). A volume indicator tells you whether the buyers or sellers behind a move are acting with conviction.
Used individually, each indicator gives you a partial picture. Combined correctly — with discipline about which tools you layer — they produce a probabilistic framework for timing entries and exits.
Why Crypto Is Different From Stocks
The default settings on most indicators (RSI 14, MACD 12/26/9, Bollinger Bands 20/2) were designed for daily stock charts in a 6.5-hour trading session. Crypto changes several of these assumptions:
- 24/7 markets. There is no overnight gap. There is no Monday open reaction to weekend news. Price can move 10% while you sleep and all of it shows in your indicator as seamless continuous data. This changes how you interpret “oversold” conditions — a Sunday-midnight RSI dip to 28 on BTC is a different event than a Tuesday 2:00 PM RSI dip to 28.
- Extreme volatility regimes. Bitcoin can go from 30-day volatility of 15% to 80% in a matter of weeks. Static ATR parameters that produce clean signals in low-volatility periods will fire constantly during high-volatility regimes. Indicators with fixed periods need frequent manual re-tuning.
- Thinner order books on altcoins. The larger the cryptocurrency’s market cap, the more like a traditional asset it behaves in technical analysis terms. BTC/USDT on Binance has enormous liquidity — RSI signals are more reliable. A small-cap altcoin with $5M daily volume will show more false signals from the same indicators because thinner books mean larger individual trades can move price without representing real trend changes.
- Session asymmetry. Even without a formal “close,” crypto has rhythms: US/EU session overlap (13:00–17:00 UTC) consistently produces the highest volume and most reliable technical signals. Asian session (02:00–08:00 UTC) and weekend afternoons are lower volume and generate more indicator whipsaws.
Understanding these differences is why experienced crypto traders modify default indicator settings — and why adaptive indicators that adjust automatically are particularly valuable on crypto.
The Four Categories of Crypto Indicators
Every indicator falls into one of four categories. Understanding the category tells you what a tool measures and — critically — what it cannot measure.
1. Trend Indicators
Trend indicators answer the question: which direction is price moving? They smooth out short-term noise and reveal the underlying direction.
Examples: Moving Averages (SMA, EMA, WMA), SuperTrend, Ichimoku Cloud, Parabolic SAR, Donchian Channels.
When they work: In trending markets. A simple 20/50 EMA crossover will capture most of a strong Bitcoin trend with clean buy and sell signals.
When they fail: In ranging, sideways markets. When BTC is consolidating between $60,000 and $65,000 for three weeks, a trend indicator will whipsaw — producing false buy signals near the top of the range and false sell signals near the bottom, generating a string of small losses.
Crypto-specific note: The Ichimoku Cloud uses Japanese trading week settings (9-26-52) designed for 6-day trading weeks. For crypto’s continuous market, many traders adjust to 10-30-60 or use the settings as-is with the understanding that the cloud’s forward projection is less time-precise than on traditional markets.
2. Momentum Oscillators
Momentum oscillators answer the question: how fast is price moving, and is that speed extreme? They typically oscillate between fixed values (0–100 for RSI, above/below zero for MACD histogram) and are used to identify overbought/oversold conditions and divergences.
Examples: RSI (Relative Strength Index), MACD (Moving Average Convergence Divergence), Stochastic Oscillator, Williams %R, CCI, WaveTrend (used in Market Cipher).
When they work: For identifying exhaustion at extremes, and for spotting divergences (price makes a new high but RSI does not — a signal that momentum is fading). RSI divergences on 4-hour BTC charts have historically preceded many significant reversals.
When they fail: Momentum oscillators can stay “overbought” for extended periods during strong crypto bull runs. RSI above 70 on BTC in a 2020–2021-style bull market was a continuous condition for months. Trading every “overbought” RSI signal as a short would have been catastrophic.
Crypto-specific note: Many experienced crypto traders shorten RSI to 9 or 10 periods (vs default 14) to make it more responsive to crypto’s faster price swings. On 4-hour charts, RSI-10 provides earlier signals than RSI-14 at the cost of slightly more false signals.
3. Volume Indicators
Volume indicators answer the question: is the price move backed by real buying or selling conviction? Price action without volume is less reliable — a breakout on low volume frequently fails.
Examples: On-Balance Volume (OBV), Volume Profile, VWAP (Volume Weighted Average Price), Money Flow Index (MFI), Accumulation/Distribution Line.
When they work: For confirming breakouts and trend continuations. A Bitcoin breakout above a major resistance level (say, $100,000) that is accompanied by record volume is far more reliable than the same breakout on low volume.
When they fail: On short timeframes in low-liquidity periods. Saturday night volume on a mid-cap altcoin is structurally different from Tuesday afternoon volume. Volume indicators work best on assets and sessions with deep, consistent participation.
Crypto-specific note: VWAP is particularly useful for crypto traders using the “Anchored VWAP” approach — anchoring the VWAP calculation to a specific event (a major local high, a capitulation low, or a BTC halving date) rather than the session start. The standard session-reset VWAP is less meaningful for 24/7 assets.
4. Volatility Indicators
Volatility indicators answer the question: how much is price moving right now compared to its average? They do not indicate direction — they indicate how “active” or “quiet” the market is.
Examples: ATR (Average True Range), Bollinger Bands, Keltner Channels, VIX (for traditional markets), Volatility Stop.
When they work: For position sizing (setting stop-losses as multiples of ATR prevents stops being placed too close during high-volatility periods), and for identifying potential breakout setups (Bollinger Band squeezes often precede significant crypto moves).
When they fail: Volatility indicators alone do not tell you the direction of the next move. A Bollinger Band squeeze (low volatility, bands contracting) signals that a significant move is coming — it does not tell you whether that move is up or down.
The Core Crypto Indicator Toolkit: Eight Indicators Ranked
1. RSI (Relative Strength Index) — The Momentum Foundation
RSI is the single most widely used momentum indicator in crypto trading, and for good reason: it is simple, visually clear, and reliable on liquid assets with consistent volume.
What it measures: The ratio of average gains to average losses over a defined period (default: 14 bars). Output: a value between 0 and 100. Above 70 = traditionally overbought. Below 30 = traditionally oversold.
How to read it for crypto:
- Standard use: Look for the RSI to reach an extreme (below 30 or above 70) and then turn back toward the midpoint — this can signal exhaustion of the short-term move.
- Divergence: Price makes a higher high, but RSI makes a lower high (bearish divergence). Or price makes a lower low, but RSI makes a higher low (bullish divergence). On 4H BTC charts, RSI divergences have a strong track record as reversal signals.
- RSI 50 as a trend filter: When RSI is above 50, the market is in a momentum-positive state. Many systematic crypto traders use RSI > 50 as a filter before taking any long signals from their trend indicator — avoiding longs in a generally bearish momentum environment.
Crypto-specific settings: RSI-10 on the 4-hour chart is more responsive to crypto’s swings. For daily charts, RSI-14 is fine. For scalping on the 15-minute chart, RSI-7 or RSI-9.
Overbought ≠ automatic sell: This is the most common RSI mistake in crypto. During the 2020–2021 bull market, BTC held RSI above 70 for 90+ consecutive days on the daily chart. If you had shorted every RSI-70 touch, you would have been destroyed by the trend. RSI overbought signals are most useful in the context of a confirmed range or at the terminal stage of a trend — not mid-trend.
Authority reference: Kraken’s technical indicator guide covers RSI mechanics and crypto-specific applications.
2. MACD (Moving Average Convergence Divergence) — Trend + Momentum Together
MACD is a two-in-one indicator: it tracks both the direction of the trend (by comparing two EMAs) and the momentum behind that trend (by showing whether the gap between those EMAs is expanding or contracting).
Components:
- MACD line: 12-period EMA minus 26-period EMA
- Signal line: 9-period EMA of the MACD line
- Histogram: The difference between MACD line and signal line — shows whether momentum is accelerating (bars growing taller) or decelerating (bars shrinking)
How to read it for crypto:
- Crossover: MACD line crosses above the Signal line = bullish signal. Crosses below = bearish signal. These work well on 4H and daily charts for trend-following entries on BTC and major altcoins.
- Zero line cross: MACD crossing from below zero to above zero (or vice versa) is a more significant trend change signal than the signal line crossover.
- Histogram momentum: Watch for histogram bars to begin shrinking after a strong run. This often precedes a MACD crossover by several bars — giving early warning of a momentum shift.
- Divergence: Like RSI, MACD histogram divergence (price makes new high, MACD histogram makes lower high) is one of the more reliable leading signals in crypto.
Crypto-specific note: MACD default settings (12/26/9) were designed for daily stock charts. On crypto’s 4-hour chart, the settings translate to roughly equivalent timeframes. Some traders use 6/13/4 on shorter timeframes for a faster-reacting MACD.
3. SuperTrend — The Best Trend-Following Tool for Crypto
SuperTrend is an ATR-based indicator that plots a single line above or below price and flips direction when price crosses it. When it’s below price (green), trend is up. When it’s above price (red), trend is down.
Why SuperTrend outperforms EMA for crypto: SuperTrend uses ATR (Average True Range) in its band calculation, which means the band automatically widens during high-volatility periods and narrows during low-volatility periods. A simple 50 EMA crossover will generate many false signals during a volatile week where BTC swings 8% in either direction. SuperTrend’s ATR-based bands absorb much of that short-term noise.
Default settings (ATR 10, Factor 3): These work reasonably well on Bitcoin 4-hour charts. For faster-moving altcoins, some traders use Factor 2 to get tighter signals at the cost of more whipsaws.
The multi-timeframe advantage: Running two SuperTrend lines simultaneously — one on the primary timeframe (fast signal) and one based on a higher timeframe (trend filter) — dramatically reduces false signals. Only take buy signals when both SuperTrend lines agree on direction. This dual-confluence approach is the core architecture behind Quantzee’s SuperTrend Pro+.
SuperTrend Pro+ adds a second ATR-based SuperTrend layer as a slow trend filter, requires both to agree before signaling, and adds a three-level ATR profit target ladder (TP1/TP2/TP3) with a dynamic stop-loss. On crypto, this dual-confluence structure eliminates a significant portion of the false signals that the standard single-line SuperTrend generates during choppy BTC consolidations. The indicator is built with confirmed-bar-close signal evaluation — meaning it never repaints, making it reliable for both live trading and backtesting.
4. Bollinger Bands — Reading Volatility and Squeeze Breakouts
Bollinger Bands consist of a middle band (20-period SMA), an upper band (SMA + 2 standard deviations), and a lower band (SMA − 2 standard deviations). They expand during high-volatility periods and contract during low-volatility periods.
How to read them for crypto:
- Band squeeze: When the bands contract to their narrowest in months (bands are close together), it signals that volatility is compressing and a significant move is imminent. This is the classic Bollinger Band squeeze setup. Crypto regularly produces these setups before major BTC moves.
- Walking the band: During strong trends, price can “walk” along the upper or lower band for extended periods. This is normal behavior in trending crypto markets and does not by itself signal an imminent reversal.
- Mean reversion: In ranging markets, price touching the upper band with a overbought RSI can signal a short entry back toward the middle band. In trending markets, this same setup is dangerous.
- Crypto setting adjustment: The default 2.0 standard deviation setting works for Bitcoin and Ethereum. For more volatile altcoins, 2.5 standard deviations reduces the frequency of false touches.
Authority reference: Changelly’s guide to Bollinger Bands and crypto indicators covers the squeeze setup in detail.
5. Volume Profile — Where Institutions Have Been
Volume Profile is a chart analysis tool that shows how much volume traded at each price level over a defined period, displayed as a horizontal histogram on the right side of the chart. High-volume price nodes (HVN) represent price levels where a lot of trading activity occurred — these act as future support and resistance.
Key concepts:
- Point of Control (POC): The price level with the highest volume traded — the most significant level on the chart.
- Value Area High/Low (VAH/VAL): The price range containing 70% of all volume. These levels frequently act as major support and resistance.
- Low Volume Nodes (LVN): Gaps in the volume profile where little trading occurred. Price tends to move quickly through these zones — which is why breakouts through volume gaps often accelerate.
Why it matters for crypto: Crypto markets have genuine institutional participants (crypto hedge funds, market makers, large OTC desks) who execute at specific price levels. Volume Profile reveals where this institutional positioning occurred, making it one of the most actionable tools for identifying genuinely significant support and resistance.
How to use it with other indicators: Volume Profile provides context; RSI and SuperTrend provide timing. A SuperTrend buy signal that fires precisely at the Point of Control from a major prior accumulation zone is a higher-quality signal than one that fires in the middle of a low-volume region.
6. On-Balance Volume (OBV) — Confirming Trend Direction With Volume Flow
OBV is a running cumulative total: on each up-close bar, the bar’s volume is added. On each down-close bar, the bar’s volume is subtracted. The resulting line shows the net flow of volume over time.
How to read it:
- OBV trend agrees with price trend: Confirmation. The volume is flowing in the same direction as price — move has conviction.
- OBV divergence: Price is making new highs but OBV is making lower highs (bearish divergence). Volume flow suggests smart money is distributing even as price is pushed higher. This is one of the more reliable distribution signals in crypto.
- OBV breakout: OBV breaks to a new high before price does — often an early signal that an accumulation phase is complete and a price breakout is imminent.
Why it matters for Bitcoin specifically: Bitcoin’s on-chain data and volume data are more transparent than many other assets, and OBV breakouts have preceded several major BTC bull runs. The key is to look at OBV on weekly and daily charts — on short timeframes, OBV is noisy.
7. VWAP — The Institutional Price Benchmark
VWAP (Volume Weighted Average Price) is the average price an asset traded at over a period, weighted by volume at each price level. It answers: where has the average dollar of volume transacted?
Two types for crypto:
- Session VWAP: Resets at a defined period start (less meaningful for 24/7 crypto).
- Anchored VWAP (AVWAP): Anchored to a specific significant event — a major high, a major low, a BTC halving event, the start of a market cycle. This is far more useful for crypto.
How to use it:
- Price above AVWAP from a major low: Buyers in control over that timeframe — bullish structural bias.
- Price below AVWAP from a major high: Sellers in control — bearish structural bias.
- AVWAP crossovers (price crossing back above from below) can signal structural trend shifts.
Institutional significance: Major crypto market makers and algorithmic trading desks use VWAP as an execution benchmark — they try to buy below VWAP and sell above it. This institutional behavior creates real support/resistance dynamics around VWAP levels that make them technically significant.
Quantzee’s VWAP Pro+ adds anchored VWAP with automatic key-level detection and multi-timeframe VWAP bands — particularly useful for intraday crypto traders who need to identify where institutional positioning is concentrated.
8. ATR (Average True Range) — Position Sizing, Not Signals
ATR measures the average range of price movement over a defined period (default: 14 bars). It does not indicate direction. It indicates how much price is moving on average — a measure of volatility.
Primary use for crypto traders: Stop-loss placement and position sizing.
- ATR-based stop-loss: If BTC’s daily ATR is $2,000, placing a stop 1× ATR below entry ($2,000 below) gives the trade room to breathe without being stopped out by normal volatility. During a 2023-style low-volatility consolidation (daily ATR of $600), the same 1× ATR stop is much tighter.
- Position sizing: If you want to risk 1% of your account per trade, and ATR tells you the expected move is $2,000 on BTC, you size your position so that a $2,000 adverse move equals 1% of account equity.
Why this matters for crypto: Fixed-dollar stops are dangerous in crypto because volatility changes dramatically between market cycles. A $500 stop on BTC that kept you in trades comfortably during a $20,000 BTC consolidation period will stop you out on every normal candle when BTC is at $100,000 with a $5,000 daily ATR.
How to Combine Indicators Without Overloading Your Chart
The most common mistake crypto traders make with indicators is using too many. Six indicators on a chart do not produce more insight than three — they produce less insight and more contradictory signals.
The Rule of Three: One Layer Per Function
The most effective crypto indicator setups use three layers, each with a distinct function:
| Layer | Function | Example Indicators |
|---|---|---|
| Trend | Which direction is price moving? | SuperTrend, EMA 200, Ichimoku Cloud |
| Momentum | Is the move strong or exhausted? | RSI, MACD, Stochastic |
| Volume | Is the move backed by conviction? | OBV, VWAP, Volume Profile |
Add a volatility tool (Bollinger Bands or ATR) as a fourth element if your strategy requires volatility context. Beyond four indicators, you are creating noise.
The Three-Step Filter for Entry Decisions
A practical framework for crypto entries using this three-layer approach:
- Trend layer confirms direction. SuperTrend is green (uptrend) on the 4H chart, AND the 50 EMA is above the 200 EMA on the daily. Both agree: the structural bias is bullish.
- Momentum layer confirms timing. RSI pulls back from overbought and turns back up from between 45 and 55 (the “RSI midline bounce”). Or MACD histogram turns from red to green while near the zero line.
- Volume layer confirms conviction. OBV is trending up, or price is holding above VWAP. The volume context agrees with the price move.
All three layers aligned in the same direction = higher-probability setup. Two out of three = marginal. One out of three = skip.
The AI Alternative: Let the Indicator Adapt
The limitation of the three-layer manual framework is that the correct parameters change as market conditions change. RSI-14 works better during low-volatility BTC periods; RSI-9 works better during volatile altcoin runs. Manually re-tuning this is time-consuming and reactive.
The AI Adaptive Quant Toolkit takes a different approach: its Autopilot engine continuously analyzes current market volatility and self-tunes its sensitivity parameters in real time. During a high-volatility crypto regime (BTC weekly ATR expanding sharply), the Toolkit automatically adjusts to wider filters to avoid the false signals that fire during choppy conditions. During low-volatility consolidations, it tightens to remain responsive.
This adaptive architecture is particularly valuable on crypto’s 24/7 markets where volatility can shift between sessions — from the high-volume US/EU overlap period to the quiet Saturday night period — without any change in trend direction. Static indicators need manual intervention to remain calibrated; the Toolkit adjusts automatically.
The Toolkit includes: trend signals, momentum confirmation, multi-timeframe analysis, and volatility-adaptive sensitivity — functioning as a self-tuning version of the three-layer stack described above. Available at quantzee.com/indicators/ai-adaptive-quant-toolkit/.
Asset-Specific Indicator Settings: BTC vs ETH vs Altcoins
Bitcoin (BTC/USDT)
Bitcoin is the most technically reliable crypto asset to trade with indicators. High liquidity, continuous institutional participation, and decades of price history mean traditional technical analysis works more consistently on BTC than on any other crypto.
Recommended settings:
- RSI: 14-period on daily, 10-period on 4H
- MACD: Default (12/26/9) on 4H and daily
- SuperTrend: ATR 10, Factor 3 on 4H; ATR 7, Factor 3 on daily
- Bollinger Bands: 20/2.0 on all timeframes
- Key timeframes: 4H for swing entries, daily for trend context, weekly for macro bias
Bitcoin-specific behavior: BTC’s 200-week moving average has historically functioned as the cycle bottom support level. Many institutional players treat this as the dividing line between accumulation (price below) and distribution (price above in late-cycle). This is worth tracking on the weekly chart as macro context for all indicator readings.
Ethereum (ETH/USDT)
ETH has become increasingly technically reliable as institutional participation has grown, particularly post-ETF approval. It tends to follow BTC’s macro direction but leads on altcoin-season rallies.
Recommended settings:
- Same RSI, MACD, SuperTrend settings as BTC
- ETH’s correlation to BTC means BTC trend context is always relevant: checking BTC’s SuperTrend status before entering an ETH trade reduces false signals
- Volume Profile on ETH is highly useful — ETH has developed clear high-volume zones at institutional accumulation levels
ETH-specific behavior: ETH/BTC ratio is a useful meta-indicator. When ETH/BTC is trending up, altcoins broadly tend to outperform BTC. When ETH/BTC is declining, BTC dominance is rising and altcoin indicators generate more false signals.
High-Cap Altcoins (SOL, BNB, ADA, etc.)
For top-20 crypto assets with $10B+ market caps, the same indicator frameworks apply but with adjustments:
- Faster RSI period: RSI-9 or RSI-10 on 4H handles the more volatile price action better
- Wider Bollinger Bands: 2.5 standard deviations reduces false breakout signals
- More weight on BTC correlation: Major altcoins move substantially with BTC. An altcoin indicator setup without a BTC trend filter layer will generate many false signals during BTC sell-offs
Low-Cap Altcoins (Below Top 100)
Technical indicators are significantly less reliable on low-cap altcoins for several reasons:
- Thin order books: Single large trades can move price significantly, creating indicator spikes that have no statistical significance
- Manipulation: Price manipulation (pump-and-dump, wash trading) on low-cap assets creates patterns that look like indicator signals but are created artificially
- Low volume: Volume indicators become meaningless when daily volume is measured in thousands of dollars rather than millions
Recommendation: On low-cap altcoins, reduce indicator reliance and weight price action (support/resistance structure) and on-chain data more heavily. If you use indicators, RSI divergences on higher timeframes (daily/weekly) are the most reliable signals.
Indicator Combinations That Actually Work on Crypto in 2026
Setup 1: The Trend-Momentum Stack (4H Swing Trading)
Best for: BTC, ETH, high-cap altcoins on 4-hour charts.
- Trend: SuperTrend Pro+ dual-confluence (both slow and fast SuperTrend must agree)
- Momentum: RSI-10, look for entries when RSI bounces from 40–55 while trend is bullish
- Volume confirmation: OBV trending up; price holding above VWAP
Entry trigger: SuperTrend Pro+ generates a long signal, RSI is 45–60 (not overbought), OBV trending up. Exit: SuperTrend Pro+‘s TP2/TP3 ATR targets, or SuperTrend flips direction.
This is a high-selectivity setup — you wait for all three conditions rather than entering on the first SuperTrend flip. Fewer signals, higher accuracy.
Setup 2: The AI-Adaptive Setup (Multi-Timeframe Crypto)
Best for: Traders who want one indicator to replace the three-layer stack.
- AI Adaptive Quant Toolkit in Trend Trader mode on 4H charts
- Autopilot handles the trend/momentum calibration automatically
- Filter: Only take toolkit signals when BTC daily SuperTrend agrees on direction
This setup is ideal for traders who do not want to manually track and adjust RSI periods, SuperTrend factors, and MACD settings across different market regimes. The toolkit self-calibrates.
Setup 3: The Volatility Breakout Setup (For BTC Squeeze Setups)
Best for: BTC/USDT on daily charts at the end of extended low-volatility consolidations.
- Bollinger Bands: Squeeze (bands at 20-period low) signals a major move is loading
- Volume Profile: Identify the Point of Control from the consolidation range — the direction of the break from this level is significant
- MACD: Watch for histogram momentum to turn decisively in one direction before the Bollinger breakout — MACD momentum often leads the Bollinger Band expansion by 1–2 bars
Entry trigger: Bollinger Band squeeze, MACD histogram turns consistently bullish, price closes above POC and upper Bollinger Band. This setup fires rarely — once or twice per year on BTC’s daily chart — but when it does, the resulting moves tend to be substantial.
The SMC Toolkit Pro and Crypto: Smart Money Concepts
Smart Money Concepts (SMC) has become one of the dominant methodologies among crypto traders, particularly in the retail community. The core premise: institutional participants (large crypto funds, market makers) leave detectable footprints in price action through specific structures — order blocks, fair value gaps, liquidity sweeps, and change-of-character signals.
Quantzee’s SMC Toolkit Pro automatically identifies these structural elements on TradingView charts:
- Order Blocks: The last up-candle before a significant bearish move (bearish OB) or the last down-candle before a significant bullish move (bullish OB) — these zones frequently act as high-probability reversal points when price returns to them
- Fair Value Gaps (FVG): Imbalances in price delivery — three-candle structures where the first and third candles don’t overlap — that price often “fills” before continuing the primary trend
- Break of Structure (BOS): The point where price definitively breaks the previous swing high or low, confirming a trend change
- Liquidity Sweeps: Price spikes that take out the obvious stop-loss levels (just below swing lows or above swing highs) before reversing — a pattern particularly common on crypto with retail stop concentrations
For crypto traders, SMC structures combine well with volume indicators. An order block that also aligns with a high-volume node from Volume Profile is a particularly strong support/resistance zone. A fair value gap that aligns with VWAP is a higher-probability fill target.
SuperTrend Fusion for Crypto Trend Cycles
SuperTrend Fusion combines two separate SuperTrend algorithms — each with different ATR and multiplier settings — into a single higher-probability signal. When both SuperTrend components agree on direction simultaneously, the Fusion fires a signal. When they disagree, no signal fires.
For crypto, this consensus approach is particularly valuable during altcoin seasons when individual crypto assets can trend strongly but briefly, with volatile reversals. The SuperTrend Fusion’s requirement for dual-algorithm agreement filters out many of the whipsaw signals that a single SuperTrend generates on high-beta altcoins.
Crypto use case: On BTC/USDT 4H during a trend breakout, SuperTrend Fusion signals the confirmed start of the trend after both algorithms have agreed — missing the first few bars but avoiding the frequent false-start signals that occur at resistance zones. The trade-off: slightly later entry, significantly higher signal quality.
What No Indicator Can Tell You: Crypto-Specific Risks
Technical indicators work on price data. They do not, and cannot, incorporate:
On-chain risk: A protocol hack, a stablecoin depeg, an exchange insolvency event (FTX in November 2022), or a large-holder (“whale”) wallet starting to distribute can cause price drops that no indicator combination could have predicted from chart data alone. The November 2022 FTX collapse moved BTC from $20,000 to $16,000 within hours — all technical indicators were bullish on many timeframes when this happened.
Regulatory news: Sudden regulatory announcements (a major jurisdiction banning crypto, or approving a new ETF type) can move crypto markets 15–30% in either direction with no technical warning. Indicators cannot read news.
Liquidity events: In thin markets (particularly on weekends and low-cap altcoins), a single large seller can cascade price through multiple support levels that looked technically significant, invalidating indicator-based setups that appeared pristine.
The implication: Technical indicators should always be used alongside awareness of macro context and on-chain monitoring. They are powerful tools for timing entries and exits within known trend structures — they are not a complete trading system in isolation.
Free vs Paid Crypto Indicators: What You’re Actually Paying For
| Feature | Free Community Indicators | Premium Suites (e.g., Quantzee) |
|---|---|---|
| Non-repainting guarantee | Rarely verified; often repaints | Verified; signal-lock architecture |
| Multi-factor confluence | Single-factor signals | Dual/multi-timeframe required |
| Adaptive parameters | Static settings only | Self-tuning (AI Autopilot) |
| Position management | No (entry signals only) | ATR-based TP/SL ladders |
| Support & documentation | Community forum only | Full documentation |
| Backtestable signals | Requires verification | Confirmed-bar-close (backtest-safe) |
| Alert integration | Basic | Full alert template library |
| Price | Free | $9.99/month (Quantzee) |
The core value of a premium indicator suite is not the signal type — free TradingView indicators can produce RSI, MACD, and SuperTrend signals too. The value is the non-repainting guarantee (which makes backtesting honest), the multi-factor confluence architecture (which reduces false signals), and the adaptive logic (which reduces the need for manual re-tuning as market conditions change).
For traders who have lost capital on repainting indicators or false-signal whipsaws, a suite like Quantzee’s — starting at $9.99/month with a 14-day money-back guarantee — is often among the lowest-cost decisions in a trading budget.
How to Verify Any Crypto Indicator Before You Trust It
Before committing capital to any indicator’s signals — free or paid — run this verification:
Step 1: Test for repainting. Open Bar Replay on TradingView (clock icon in toolbar). Step through 30–50 bars one at a time. Note any buy or sell arrows that appear, then step forward one bar. Do the arrows from the previous bar still appear in the same position? If they disappear or move — the indicator repaints. Stop here. See our full guide: how to test any TradingView indicator for repainting.
Step 2: Test on multiple market regimes. Go back to a period of strong trending (e.g., BTC October–November 2023 rally) and see how the indicator performed. Then check a period of heavy ranging (e.g., BTC sideways in Q1 2024). Does the indicator produce acceptable results in both? A trend indicator will always look great in trending periods and terrible in ranging periods — the question is whether the ranging losses are manageable.
Step 3: Test out-of-sample. If you optimized your setup during one period, test it on a completely different date range the setup has never been applied to. If results hold up — the setup has a genuine edge. If they collapse — the setup was curve-fitted to the test period. See our complete backtesting guide for the full methodology.
Step 4: Check signal frequency. An indicator that fires 3–4 times per week on BTC 4H is tradeable. An indicator that fires 40 times per day is a trading cost machine. Match signal frequency to your available trading time and transaction cost structure.
SEBI and Regulatory Positioning for Indian Crypto Traders
Indian traders using TradingView indicators for crypto need to be aware of evolving regulatory context. SEBI regulates Indian securities markets, not cryptocurrency directly — crypto regulation in India falls under the Ministry of Finance and RBI guidelines that have evolved significantly since 2022.
Quantzee’s position: All Quantzee indicators are analytical software tools for chart analysis — not financial advice, not investment recommendations, and not automated trading systems. They produce visual signals that a human trader interprets and acts on using their own judgment. This is the same category as a standard TradingView community indicator or a screener tool.
Using crypto indicators for your own research, chart analysis, and trading decisions in India is consistent with treating them as analytical tools. The “not investment advice” framing that Quantzee applies to all its indicators is particularly important for Indian crypto traders given the regulatory environment. No indicator, including Quantzee’s suite, should be treated as a guaranteed profit system or a substitute for individual research and risk management.
Frequently Asked Questions
Conclusion: Building Your Crypto Indicator Framework
The goal of using technical indicators is not to find the “perfect” indicator that never fails. No such tool exists. The goal is to build a systematic framework that puts the statistical probability in your favor more often than chance, while defining exactly when you are wrong (your stop-loss) so that each losing trade costs you a defined small amount while each winning trade captures more.
For crypto specifically, that framework in 2026 looks like:
- Trend layer: SuperTrend Pro+ or a dual EMA structure to define the directional bias
- Momentum layer: RSI-10 on 4H to time entries when momentum is positive but not extended
- Volume layer: OBV trending in the direction of trade, or price holding above VWAP
- Non-repainting verification: Test every indicator you use via Bar Replay before trusting it
- Adaptive option: AI Adaptive Quant Toolkit as a single tool that handles trend + momentum + adaptive calibration automatically
The combination of these elements — validated, non-repainting signals backed by multi-factor confluence — is what separates systematic crypto trading from chart pattern guessing.
All 13 Quantzee indicators are available at $9.99/month with a 14-day money-back guarantee. Built for TradingView, non-repainting by architecture, and designed for the 24/7 volatility regimes that define crypto markets.
Related Reading
- Best TradingView Indicators for Crypto Trading in Australia
- Why Crypto Traders Are Moving Off Trading Bots in 2026
- Paid Crypto Signal Groups: What You’re Really Paying For
- The Complete Guide to Trading Indicators and Signals
- Best Buy Sell Indicator for TradingView 2026
- How to Backtest a TradingView Indicator (Complete Guide)
- Non-Repainting TradingView Indicators: The Complete Guide
Authority References
- Kraken: Crypto Technical Indicators Guide — Beginner-friendly walkthrough of RSI, MACD, and Bollinger Bands in crypto context.
- Changelly: Best Indicators for Crypto Trading — Covers OBV, Ichimoku, and Bollinger Band setups for crypto markets.
- Investopedia: MACD — Canonical MACD definition, components, and interpretation.
- Investopedia: RSI — RSI formula, standard levels, and divergence explanation.
- Investopedia: Average True Range (ATR) — ATR calculation and application for position sizing and stop-loss placement.
- Investopedia: On-Balance Volume (OBV) — OBV mechanics and how to interpret volume divergences.
- TradingView Pine Script: Repainting Documentation — Technical explanation of repainting causes and how to avoid them.
- SEBI: Investor Education — India’s Securities and Exchange Board for regulatory context on trading tools and algorithmic trading.
Educational Disclaimer: All content in this article is for informational and educational purposes only. Quantzee indicators are analytical software tools designed for chart analysis — they are not financial advice, investment recommendations, or guarantees of any trading result. Crypto markets are highly volatile and past indicator performance does not predict future market outcomes. Always conduct your own research, manage your own risk, and consult a qualified financial adviser before committing capital to any trading strategy. The term “analytical software” describes the category of tool these indicators represent — they do not constitute personalised investment advice under any jurisdiction’s regulations.