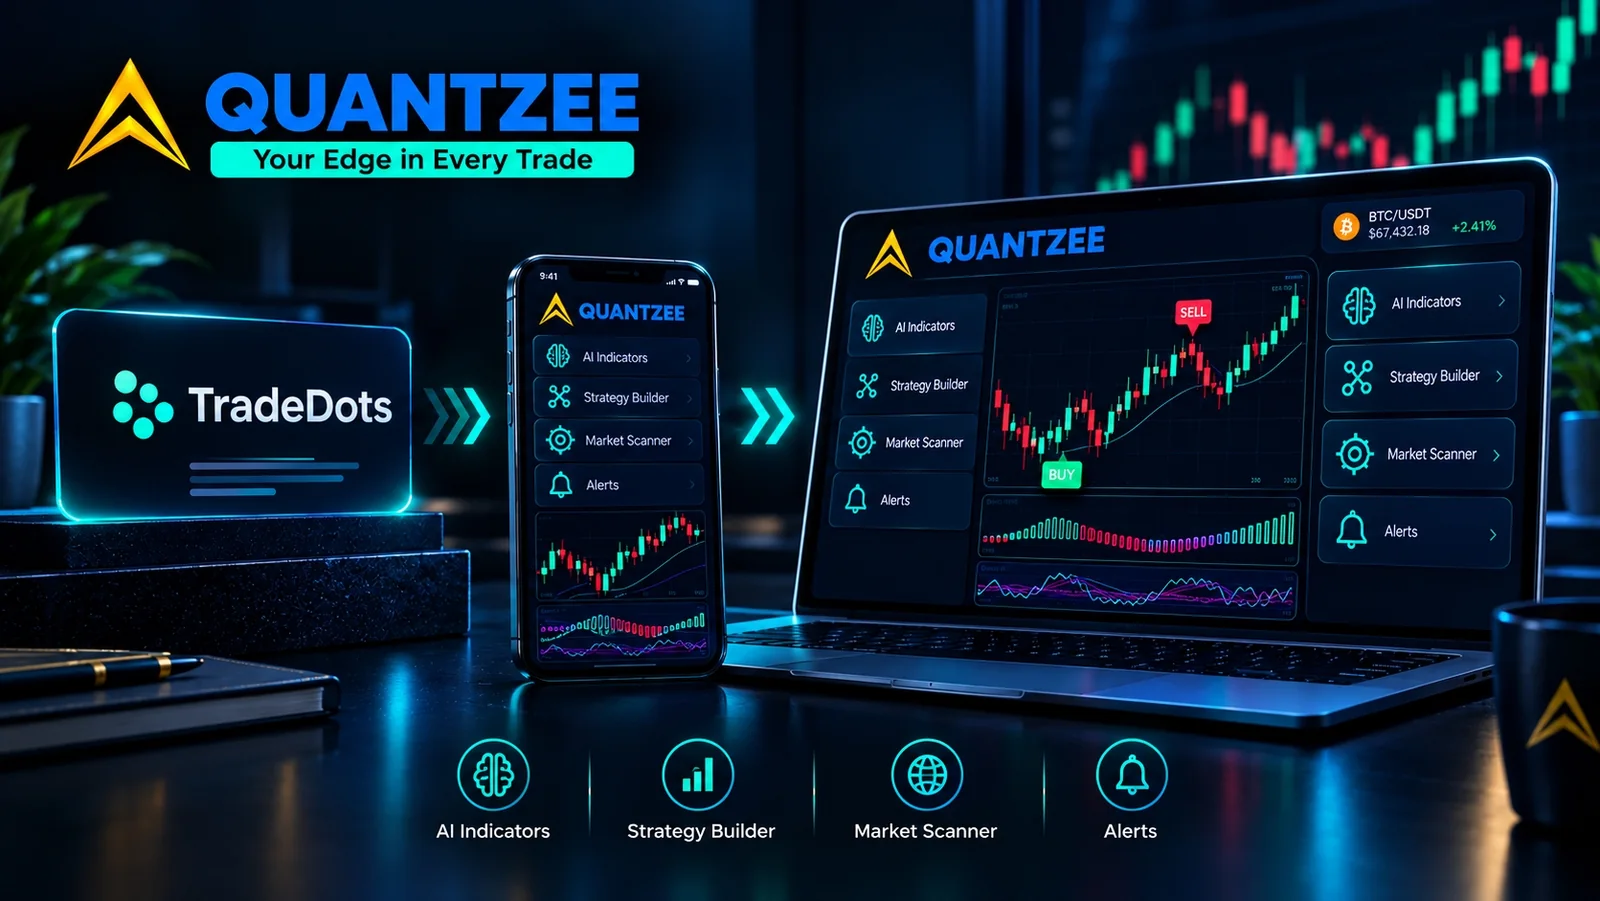
TradeDots and Quantzee both sit in the TradingView paid indicator space, but they are designed around different trader profiles. TradeDots positions itself as a portfolio analysis and AI-powered market ecosystem for strategic, longer-timeframe investors. Quantzee is built for active traders — swing traders and day traders — who want real-time, actionable signals with clear risk management output directly on their charts.
If you have been using or evaluating TradeDots and feel the signals are not fast enough, precise enough, or suitable for your active trading style, this page explains why, and what Quantzee offers as a structurally different alternative.
⚡ Key Takeaways
- TradeDots costs $55.30/month (Basic) or $90.30/month (Pro) — $664 to $1,084 a year. Quantzee is $59.99 once, roughly one TradeDots Basic month, and TradeDots also offers no permanently free indicators to test before committing.
- The Quantzee suite's non-repainting architecture is independently testable on your own charts.
- TradeDots is designed for strategic portfolio management on daily/weekly timeframes; Quantzee is built for active swing and day traders who need real-time, actionable signals on sub-hourly charts.
- Quantzee's non-repainting claim is independently testable on any of its 6 indicators; TradeDots' claim has limited independent third-party verification and some user reports of repainting.
- SuperTrend Pro+ auto-plots an entry, stop-loss, and ATR-based take-profit ladder directly on the chart with every signal — TradeDots provides directional signals without on-chart SL/TP levels.
Top 4 Alternatives to TradeDots in 2026 (Quick Comparison)
If you’re comparing TradeDots against the field rather than just against one competitor, here’s where it sits relative to the other tools traders in this category most often shortlist:
| Rank | Tool | Category | Starting Price | Notable Limitation / Fit |
|---|---|---|---|---|
| 🏆 1 | Quantzee | AI signal indicators (TradingView) | $59.99 once — Pine source emailed, no renewal | Non-repainting, verifiable on Bar Replay, covers crypto, stocks, forex & commodities |
| 2 | TradeDots | — | $55.30–$90.30/mo | portfolio-level strategy tool, not active-trading signals |
| 3 | AI Signals | Related tool in this category | See full comparison | Different feature/price tradeoff — worth shortlisting alongside TradeDots |
| 4 | EliteSignals | Related tool in this category | See full comparison | Different feature/price tradeoff — worth shortlisting alongside TradeDots |
Quantzee tops this list on price-to-signal-clarity ratio — $59.99 paid once against TradeDots’s $55.30–$90.30 every month, with non-repainting logic you can verify yourself before paying. The detailed, feature-by-feature comparison against TradeDots specifically follows below.
What is TradeDots?
TradeDots is an AI-powered indicator suite and portfolio management tool that operates on TradingView and its own companion app. It covers multiple asset classes — stocks, forex, crypto, futures, and commodities — and is positioned around giving investors a comprehensive view of their portfolio and market trends rather than point-in-time trade signals.
TradeDots core features
Multi-asset AI signals on TradingView: TradeDots provides professional-grade indicators that generate buy/sell alerts across markets and timeframes, with a no-repainting claim on its marketing material.
Portfolio performance and risk analytics: One of TradeDots’ distinguishing features is portfolio-level tracking — measuring historical performance, generating risk reports, and monitoring portfolio health over time. This is oriented toward investors managing multi-position books rather than traders managing individual short-term trades.
Real-time alerts: Notification system for when key signal setups trigger.
AI app integration: TradeDots offers a companion app beyond TradingView for portfolio monitoring and signal review.
Who TradeDots is designed for
Based on TradeDots’ own positioning and its feature set, it is most naturally suited to:
- Strategic equity investors managing a multi-stock portfolio who want AI-guided trend signals and a portfolio performance overlay
- Swing traders on daily or weekly timeframes who are comfortable with signals designed for longer-duration positions
- Traders interested in portfolio analytics alongside trade signals — not just individual trade entry/exit points
What TradeDots is not primarily designed for: high-frequency intraday scalping or precision-timed short-duration setups on sub-hourly charts.
TradeDots pricing (2026)
| Plan | Monthly | Annual |
|---|---|---|
| Basic | $55.30/month | $664/year (~$55/month) |
| Pro | $90.30/month | $1,084/year (~$90/month) |
At $664–$1,084 per year for the annual plans, TradeDots is priced at the premium end of the retail indicator market. For comparison, this is more than most mainstream TradingView indicator suites and more than several comprehensive AI indicator alternatives.
There is currently no free tier for TradeDots beyond the product website information. The absence of a permanently free indicator to test the non-repainting claim and signal quality before committing to the annual pricing is a notable gap.
Where traders find TradeDots limiting
Signal timing for intraday use
TradeDots’ signals are designed for a broader timeframe framework. Community feedback and independent user reports indicate that for very fast intraday decisions — 5-minute or 15-minute chart entries on a volatile day — the signals can lag or be too broad for precise execution. This is consistent with TradeDots’ positioning as a strategic/longer-term tool rather than a scalping aid. It is not a bug in the product; it is a design choice. But it means TradeDots is a poor match for active day traders.
Independent review scarcity
One concern flagged in community discussions is the limited number of independent, third-party reviews of TradeDots outside the platform’s own marketing. Some traders who tested TradeDots independently report signal accuracy in the 50–60% range in certain testing periods, and noted occasional repainting behaviour despite the platform’s non-repainting marketing claim. Neither positive nor negative anecdotal reports from individual traders should be taken as definitive — but the scarcity of independent verification makes due diligence harder.
Before committing to any indicator suite — TradeDots or otherwise — run the repainting test yourself: screenshot a signal when it fires, wait for five to ten candles to close, and check whether the signal changed. This is the only reliable independent verification.
No direct trade execution
TradeDots generates signals on TradingView but does not execute trades automatically or connect to brokers. This is standard for TradingView indicators and is not a specific weakness, but it means you still need to manage execution yourself based on the signals.
Premium pricing with limited free evaluation
At $55.30–$90.30/month, TradeDots asks for a meaningful commitment before a trader can fully evaluate signal quality across live conditions. This makes the decision risk asymmetric — especially given the limited independent review base.
TradeDots pros and cons
Where TradeDots has genuine strengths:
- Portfolio-level analytics and performance tracking — genuinely differentiated from pure signal tools
- Multi-asset coverage on TradingView across stocks, forex, crypto, futures, and commodities
- Non-repainting claim with buy/sell signals and real-time alerts
- Companion app for portfolio monitoring beyond TradingView
Where traders find limitations:
- Higher price point ($664–$1,084/year) relative to alternatives
- Signals better suited to daily/weekly strategic trading than intraday execution
- Limited independent third-party verification of non-repainting and accuracy claims
- No permanently free indicators to test before subscribing
- Some independent user reports of signal accuracy below advertised levels and occasional repainting
Meet Quantzee: the active-trader alternative
Quantzee is purpose-built for traders who need real-time, actionable signals on their active positions — not portfolio analytics for a long-term book. The design focus is precision: clear entry signals, auto-plotted stop-loss levels, multiple take-profit targets, and an on-chart confidence dashboard that tells you when to be aggressive and when to step back.
The structural differences
Active trading vs. strategic investing: Quantzee’s signals are optimised for swing and intraday timeframes where the trader is making multiple decisions per session. TradeDots’ portfolio analytics and broader signal framework are more naturally aligned with daily and weekly timeframes.
Verified non-repainting: Quantzee’s non-repainting claim is independently testable on TradingView without a paid commitment. The Quantzee indicator suite is available to anyone. Apply it to a chart, run the screenshot-and-wait repainting test, and verify the claim directly before spending anything.
On-chart SL/TP levels: SuperTrend Pro+ auto-plots an ATR-based entry, stop-loss, and take-profit ladder directly on the price chart. This removes the guesswork around risk management that comes with indicators that only tell you direction without risk parameters.
One payment, all markets: Quantzee covers all TradingView markets (stocks, forex, crypto, indices, commodities) from the single $59.99 purchase. There are no per-asset-class add-ons and no renewal.
Verify before committing
The Quantzee indicator suite is $59.99 once for all 6 indicators, with the Pine Script source emailed to you — no free tier or trial. Before buying, run a hands-on comparison: apply any indicator alongside whatever else you’re evaluating, run the repainting test, and see what consistent non-repainting signals look like in practice.
If you trade intraday or swing, not just portfolio-level, Quantzee’s auto-plotted SL/TP fits your timeframe better than TradeDots’ portfolio analytics.
TradeDots vs Quantzee: direct comparison
| Feature | TradeDots | Quantzee |
|---|---|---|
| Primary Use Case | Strategic portfolio management and market scanning | Active swing and day trading with real-time signals |
| Signal Timeframe Fit | Daily/weekly (longer-duration positions) | Intraday to weekly (short to medium-term) |
| Non-Repainting | Claimed — independent verification limited | Verified — testable directly on TradingView using any Quantzee indicator |
| On-Chart SL/TP | Limited — signal direction focused | Auto-plotted via SuperTrend Pro+ |
| Portfolio Analytics | Yes — comprehensive portfolio tracking | No — signal and indicator focused |
| Pricing | $664–$1,084/year | Single subscription (see pricing page) |
| Free Entry Point | None | No trial — one $59.99 purchase |
| Independent Reviews | Limited publicly available | Community discussions on Reddit, TradingView |
Who should use which tool?
TradeDots may be the better fit if:
- You manage a multi-stock or multi-asset portfolio and want AI-guided performance tracking and portfolio analytics as a primary use case
- You trade on daily or weekly timeframes and want broader market scanning alongside signal generation
- The companion app for portfolio monitoring outside TradingView is a workflow you find useful
Quantzee is the better fit if:
- You are an active swing trader or day trader who needs real-time, actionable signals with clear entry/exit levels
- You want to independently verify non-repainting claims before paying anything
- You want on-chart SL/TP levels as an integrated part of the signal output
- Budget is a consideration — $59.99 once against $664–$1,084 a year is a different order of commitment, and the non-repainting signals are testable before you spend anything
Conclusion
TradeDots and Quantzee serve genuinely different trader profiles. TradeDots’ portfolio analytics and strategic signal framework are most useful to investors managing longer-duration positions and multi-asset books. If that is your trading style, TradeDots’ features are relevant — but evaluate the pricing carefully against the limited free evaluation options.
Quantzee is built for active traders who want precision, non-repainting signals with on-chart risk management. The independent testability of the non-repainting claim gives you a verified starting point that TradeDots does not offer. Add any Quantzee indicator to your charts today and run your own due diligence before you buy.
Quantzee indicators are analytical software tools designed to assist your own analysis. This content is for educational purposes only and does not constitute investment advice. Do your own research. Trading involves risk of capital loss. Quantzee is not a registered investment advisor. Analytical software, not investment advice.
Frequently Asked Questions
Explore Quantzee Indicators
- AI Adaptive Quant Toolkit — AI signal classifier with 4 confidence levels
- AI TrendPulse — real-time trend detection with commentary
View all indicators · See pricing