Every trader has had the same experience: an indicator fires a clear buy arrow, you enter — and an hour later the arrow has quietly disappeared. The signal that looked perfect on the historical chart was never actually there in real time. You traded a lie.
This is the repainting problem, and it is the single biggest reason why most buy/sell indicators on TradingView fail in live use despite looking spectacular in screenshots and backtest results. A buy/sell indicator that repaints is not an indicator — it is a chart decoration that convinces you it predicted the past.
This guide covers the full picture: what a buy/sell indicator actually is, how the best ones generate signals mechanically, why non-repainting matters above everything else, how to test any indicator yourself in under five minutes, how to automate alerts so you never miss a signal, and which indicators — free and paid — actually produce reliable buy/sell signals in 2026 across stocks, crypto, forex, and global indices including NIFTY.
Disclaimer: All content is for educational and informational purposes only. Quantzee’s indicators are analytical software tools, not financial advice. Past signal patterns on historical charts do not guarantee future results. Always conduct your own research and apply your own risk management before making any trading decision.
What Is a Buy/Sell Indicator on TradingView?
A buy/sell indicator is a script that runs on a TradingView chart and plots visual markers — typically arrows, labels, or colored bars — directly on the price chart at points where the underlying logic detects a potential trade opportunity. A green up-arrow marks a potential long entry; a red down-arrow marks a potential short entry.
That is the simple version. The more useful question is: what logic is generating those markers?
The answer varies widely. Some buy/sell indicators are pure price-action tools — they mark swing highs and lows, or detect breakout bars, and fire signals when the pattern completes. Others layer in momentum logic: an RSI reading at an extreme combined with a MACD crossover. The most sophisticated current tools use multi-factor confluence — requiring two or more independent conditions to align simultaneously before a signal fires — which dramatically reduces false signals at the cost of lower signal frequency.
What all of them share is the same visual output: arrows on the chart where the algorithm detected a signal. The difference in reliability between a free community script and a well-built premium indicator comes down almost entirely to the quality of the underlying logic and, critically, whether the signals are non-repainting.
How Buy/Sell Arrows Are Plotted in Pine Script
TradingView indicators are written in Pine Script, TradingView’s proprietary scripting language. A buy/sell signal in Pine Script typically works like this:
buySignal = (condition1) and (condition2) and (condition3)
plotshape(buySignal, style=shape.labelup, location=location.belowbar, color=color.green)
The conditions are evaluated on each bar close. When all conditions resolve to true, the shape is plotted. The moment the next bar opens, those conditions are re-evaluated — and this is where repainting either does or does not occur.
In a properly written non-repainting indicator, the conditions only look at confirmed (closed) bars. In a repainting script, the conditions may use security() calls with lookahead=on, or reference higher-timeframe data that has not yet closed, or include variables that can change on an open bar. The result: the signal appears, disappears, or moves to a different bar as new price data arrives.
Why Non-Repainting Is the Only Criterion That Matters
Before evaluating any buy/sell indicator — free or paid, community or premium — the single test that should happen first is the repainting test. Everything else (signal frequency, accuracy statistics, visual design, alert features) is irrelevant if the indicator repaints.
Here is why. When you look at a TradingView chart with a repainting buy/sell indicator loaded, the signals you see on historical bars are the signals the indicator now shows given current data — not the signals it would have shown at the time. Every backtest, every screenshot, every vendor performance claim based on the chart history of a repainting indicator is fabricated. The “87% win rate” in the description is the win rate of signals that were retroactively placed after the outcome was known.
The practical consequence: a repainting indicator will always look impressive on past data and perform randomly in live trading. You may get lucky on some trades. On others, the signal that triggered your entry will disappear from the chart entirely, leaving you holding a position that the indicator no longer even acknowledges placing you in.
How to Test Any Indicator for Repainting in 5 Minutes
TradingView’s Bar Replay function makes this straightforward:
- Add the indicator to any chart with at least three months of history.
- Click the clock icon in the TradingView toolbar to open Bar Replay.
- Set the replay start to a point at least one month in the past.
- Step through bars one at a time using the right arrow key.
- On each bar, note whether any buy/sell arrows appear on that bar.
- Step forward one more bar, then look back at the previous bar.
- If the arrow that appeared on bar N has disappeared or moved when bar N+1 forms — the indicator repaints.
For a comprehensive walkthrough of this test across different repainting types, see our guide on how to test any TradingView indicator for repainting. TradingView’s own Pine Script documentation covers the common repainting causes in technical detail.
How Buy/Sell Signals Are Generated: Five Core Approaches
Understanding how a buy/sell indicator generates its signals helps you evaluate whether it is likely to work for your trading style.
1. Trend-Following Buy/Sell Signals
The most common approach. A trend indicator (SuperTrend, EMA crossover, Donchian channel) defines the current direction. When direction flips from bearish to bullish, a buy signal fires. When it flips from bullish to bearish, a sell signal fires.
Characteristics: signals are clear and non-subjective. In strong trends, these signals capture the entire move. In ranging markets, they produce repeated false signals as the trend indicator flips back and forth — whipsaws.
The standard SuperTrend built into TradingView is the simplest example. At default settings (ATR 10, factor 3), it flips direction when price crosses its band and generates a buy/sell signal on that bar. Because the signal is based on a closed-bar ATR calculation, it is non-repainting by mathematical construction — once a bar closes and the band direction is set, it does not change.
2. Momentum Reversal Buy/Sell Signals
Oscillator-based approach. RSI reaching oversold conditions (typically below 30) generates a buy signal; reaching overbought (above 70) generates a sell signal. MACD histogram crossing from negative to positive generates a buy; the reverse generates a sell.
Characteristics: these signals work well in ranging markets and poorly in strong trends. In a persistent uptrend, RSI can remain overbought for dozens of bars — selling every “overbought” signal would have cost you the entire trend. Most effective when combined with a trend filter that gates momentum signals (e.g., only take RSI buy signals when price is above the 200 EMA).
3. Candlestick Pattern Recognition
Pattern-detection logic identifies specific multi-bar formations — hammer, engulfing candle, morning star, bullish harami — and fires a buy signal when the pattern completes. The signal fires on the bar where the pattern is confirmed.
Characteristics: pattern signals are low-frequency but often high-precision when the pattern appears in the right context (at a key support level, after a defined trend). The limitation is that most candlestick pattern indicators fire signals regardless of market context — they mark every hammer, regardless of whether it appears in a downtrend near support (meaningful) or mid-range in a consolidation (not meaningful).
4. Multi-Factor Confluence Systems
The approach used by premium buy/sell indicators. Multiple independent conditions — trend direction, momentum, volatility regime, multi-timeframe alignment — must all agree before a signal fires. The result is fewer signals but significantly higher-quality ones.
Example logic: buy signal fires only when (a) both a fast and slow SuperTrend agree on bullish direction, AND (b) RSI has just exited oversold, AND (c) the higher timeframe trend is bullish. All three must be true simultaneously.
Characteristics: signal frequency drops significantly compared to single-condition indicators — there may be two or three confluence signals per session on a 5-minute chart instead of twenty. The trade-off is that the signals that do fire carry substantially higher probability because they require multiple independent filters to align.
5. Machine Learning and Adaptive Classification
The most sophisticated current approach. Rather than fixed parameters (SuperTrend factor 3, RSI period 14), adaptive indicators evaluate their own performance across multiple parameter combinations in real time and select the configuration that has produced the cleanest signals in current market conditions.
Investopedia’s overview of algorithmic trading explains why adaptive systems have an advantage: they can respond to changing volatility regimes that render fixed-parameter indicators temporarily ineffective without requiring manual parameter adjustments.
Free Built-In Buy/Sell Indicators on TradingView
For traders who are not ready to invest in a paid indicator, TradingView’s built-in library includes several tools that generate functional buy/sell signals.
SuperTrend (Built-In, Free)
The most widely used free buy/sell indicator on TradingView. The signal logic is simple and transparent: price crossing the ATR-based band triggers a flip, and buy/sell labels can be added via the indicator settings. Non-repainting by construction.
Recommended settings for daily/swing trading: ATR Period 14, ATR Multiplier 3.0 (default). For intraday: ATR Period 10, ATR Multiplier 2.0–2.5.
Limitation: Single SuperTrend has no chop filter. In ranging markets, the band flips repeatedly, generating a sequence of false buy/sell signals in both directions. Standard SuperTrend wins roughly 43–50% of trades on its own across mixed conditions — close to random at default settings in non-trending markets.
EMA Crossover (Built-In, Free)
The classic two-EMA crossover: when the fast EMA crosses above the slow EMA, a buy signal; below, a sell signal. Simple to understand, widely used.
Limitation: EMA crossovers are inherently lagging — the cross happens after the move has already begun. In slow-moving markets, you may enter after 30–50% of the move is complete. In fast-moving markets, you may experience “death crosses” that reverse immediately.
RSI (Built-In, Free)
At default settings (period 14, overbought 70, oversold 30), RSI generates a potential buy signal when exiting the oversold zone and a sell signal when exiting overbought. Not a pure buy/sell indicator, but paired with a trend filter it functions as an effective confirmation layer.
Limitation: Period 14 at default is poorly calibrated for intraday charts. RSI tends to produce many false reversals on fast timeframes where 14 bars covers too short a time window to carry meaning.
MACD (Built-In, Free)
When the MACD line crosses above the signal line with positive histogram momentum: potential buy. The reverse: potential sell. Again, confirmation rather than primary signal in most effective setups.
Community Scripts (Free, Quality Varies Widely)
TradingView’s public library contains thousands of “buy sell signal” scripts from community contributors. The TradingView community scripts page lists hundreds of these indicators.
Critical warning: The repainting rate among community buy/sell scripts is extremely high. Many of the most-viewed and most-liked community buy/sell indicators repaint. Never use a community buy/sell script without running the Bar Replay repainting test described above. The fact that a script has thousands of likes is not evidence that it is non-repainting.
The Problem With Most Buy/Sell Indicators: False Signal Rate
Even among non-repainting indicators, the false signal rate is the most important practical metric — and most buy/sell indicator marketing never mentions it honestly.
A false signal is a buy/sell signal that produces a losing trade. Every buy/sell indicator generates false signals. The question is how many — and whether the winning signals are large enough to more than compensate.
The core trade-off in buy/sell indicator design:
More signals = more false signals. A single-condition indicator (SuperTrend alone) fires frequently. In a ranging market, the majority of those signals may be false. A multi-confluence indicator fires far less frequently but has a higher hit rate on each signal that fires.
Fewer signals = missed opportunities. A very strict multi-confluence system may fire two or three signals per week on a daily chart. If your account requires more frequent trading to satisfy your process, this creates a practical problem separate from signal quality.
Understanding the stats that actually matter. Most vendor win-rate claims are calculated over a cherry-picked trending period or use optimized-in-sample parameters. What you need to see is:
- Win rate over a 12-month period that includes both trending and ranging conditions.
- Average win size vs. average loss size (R-multiple).
- Maximum drawdown during the test period.
- Whether the test was done on closed bars (not live bar) — the only valid test for a non-repainting indicator.
No vendor should be trusted who cannot provide the methodology behind their performance statistics.
Best Buy/Sell Indicators for TradingView in 2026 (Ranked)
#1: SuperTrend Pro+ — Dual-Confluence Buy/Sell with ATR Trade Levels
SuperTrend Pro+ is Quantzee’s enhanced version of the most-used buy/sell indicator on TradingView, built to fix the core problem that makes standard single SuperTrend unreliable: its complete absence of a chop filter.
How the dual-confluence buy/sell system works:
Instead of one SuperTrend, Pro+ runs two simultaneously — a fast one (default ATR 10, factor 2) and a slow one (default ATR 20, factor 4). A buy signal fires only on the bar where both SuperTrends first agree that the trend is bullish. A sell signal fires only on the bar where both first agree the trend is bearish.
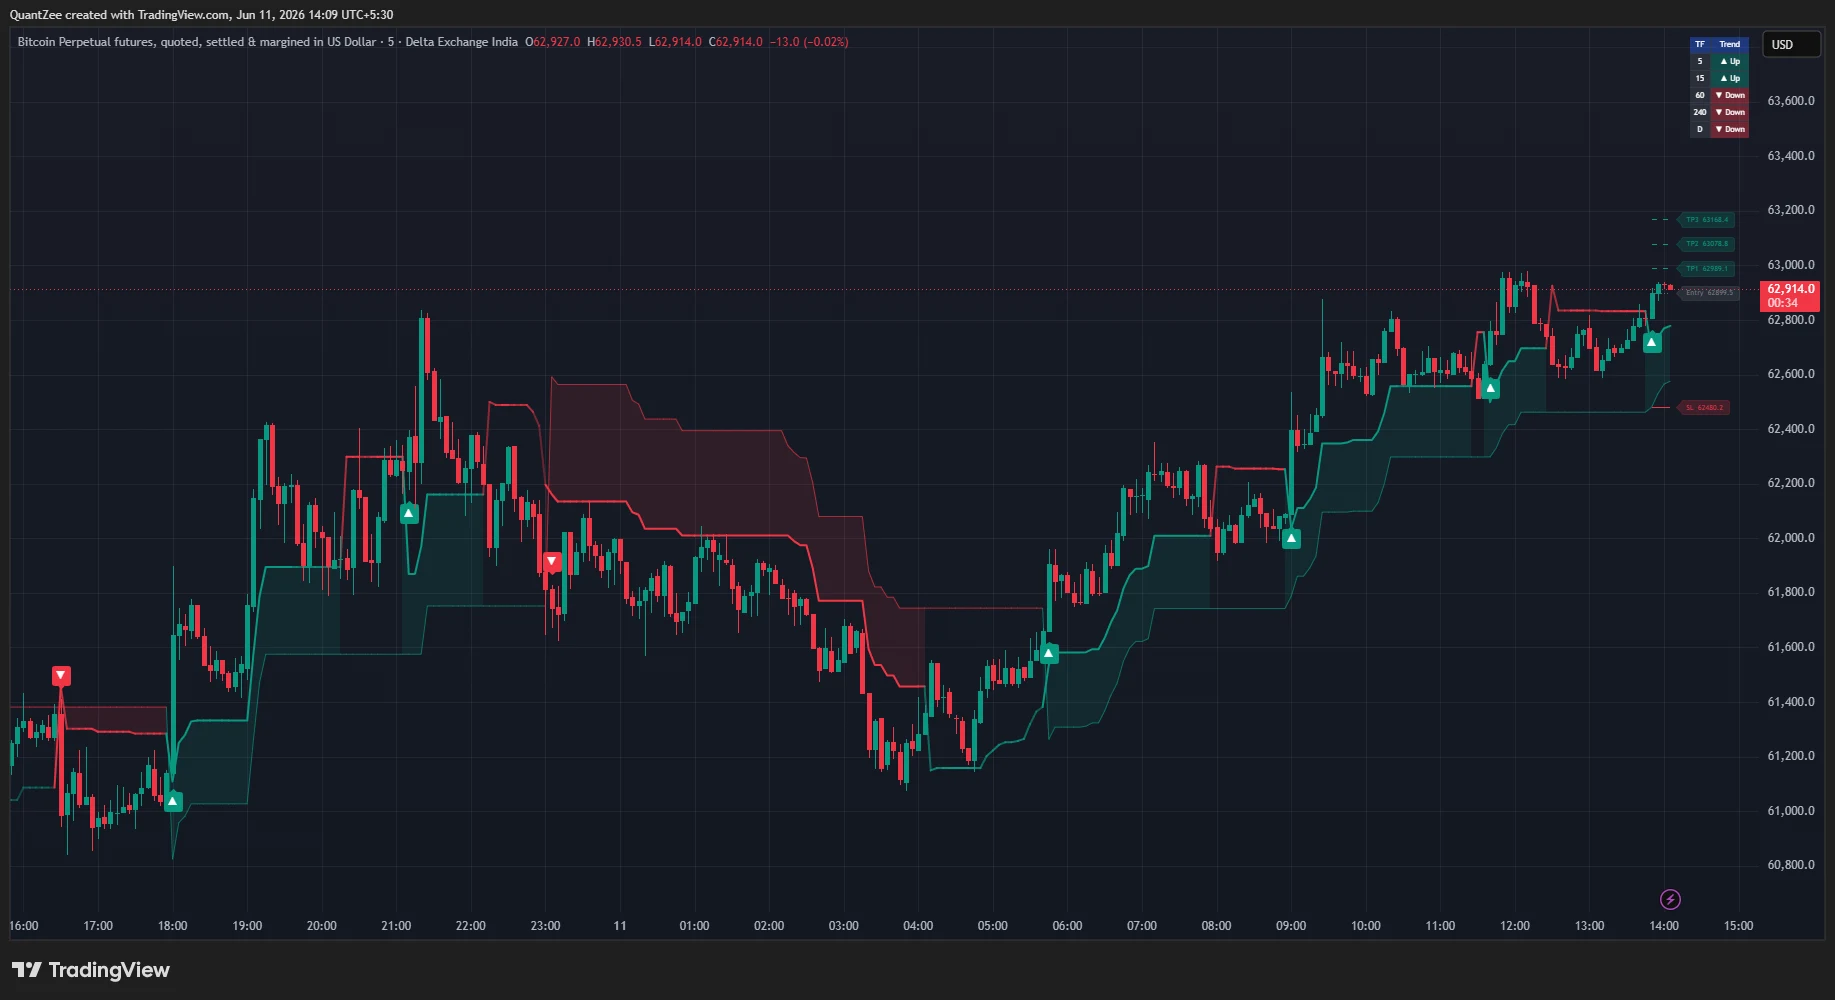
The visual output: the zone between the two SuperTrend lines is shaded green when both are bullish, red when both are bearish, and unshaded when they disagree. The buy/sell signal label appears exactly at the bar where both first align. When the two SuperTrends disagree — the most common condition in ranging markets — no signal fires and there is no shading. The chart tells you unambiguously to stand aside.
This single change — requiring two independent SuperTrend calculations to agree — eliminates the majority of the false buy/sell signals that plague standard single SuperTrend in choppy conditions.
Automatic ATR Trade-Level Ladder:
On every confirmed buy or sell signal, Pro+ automatically draws the complete trade plan: entry price, three take-profit levels at configurable ATR multiples (default TP1 = 1× ATR, TP2 = 2× ATR, TP3 = 3× ATR), and a stop-loss at the slow SuperTrend line. These levels are drawn as horizontal rays extending forward on the chart until the next signal fires.
This means every buy/sell signal from SuperTrend Pro+ comes pre-packaged with a mechanical risk management framework — no manual level calculation required.
Trend-Strength Gradient:
The fast SuperTrend line changes opacity based on the normalized distance between price and the slow SuperTrend. A bright, solid line signals strong trend momentum. A fading, lower-opacity line warns that the trend is losing energy before any flip occurs. For traders managing positions in real time, this is an early warning that the trend is decelerating — the cue to tighten stops or reduce size before the official sell signal fires.
Multi-Timeframe (MTF) Trend Dashboard:
A compact table shows the direction of the slow SuperTrend across five user-selectable timeframes simultaneously. A trader on the 5-minute chart can instantly see whether the 15m, 1H, 4H, and Daily are also bullish before entering a long on the buy signal. When all timeframes agree, the signal carries the highest structural confidence.
Non-repainting guarantee: Confluence signals evaluate on the chart timeframe bar close. The ATR ladder draws only on confirmed bar closes. MTF data uses lookahead=false. Historical signals do not move or disappear.
Four Built-In Alerts:
- Long confluence (buy) signal
- Short confluence (sell) signal
- Fast trend flip up
- Fast trend flip down
Set alerts to “Once per bar close” for confirmed, non-repainting signal notifications. These alerts can be routed to webhooks for automated execution via SignalStack or Alertatron — covered in the automation section below.
Available at quantzee.com/indicators/supertrend-pro/ — part of the full Quantzee subscription starting at $9.99/month with a 14-day money-back guarantee.
#2: AI Adaptive Quant Toolkit — Intelligent Buy/Sell Signals with Self-Tuning Parameters
The AI Adaptive Quant Toolkit takes buy/sell signal generation a step further: instead of fixed ATR parameters, the Toolkit’s Autopilot engine evaluates dozens of ATR multiplier combinations simultaneously in real time, computes a performance index on directional price behavior across each combination, selects the optimal parameter cluster via adaptive clustering, and regenerates its buy/sell signals automatically.
The practical result: the Toolkit adapts to changing volatility regimes without manual parameter adjustment. A set of parameters that performs well during a high-volatility trending session will be replaced by a tighter parameter set during a low-volatility consolidation — automatically, without you touching a setting.
AI Signal Classifier (Level 1–4):
Every buy/sell signal the Toolkit generates is automatically graded from Level 1 (early-stage, context-dependent) to Level 4 (highest-confidence, multiple internal filters aligned simultaneously). Level 4 signals require the most conditions to align; they fire infrequently but carry the highest continuation probability. Level 1–2 signals are more numerous and more context-sensitive.
A practical approach: trade Level 3–4 signals with full size, reduce size on Level 2, and observe Level 1 signals without acting unless other confirming factors are present.
Four Operating Layers:
The Toolkit operates across four integrated layers that all contribute to each buy/sell signal:
- Signal Layer: Detects momentum and trend-state transitions with the Autopilot-adapted SuperTrend matrix.
- Overlay Layer: Dynamic support/resistance via SmartTrail, TrendCatcher, TrendTracer, and NeoCloud — the structural context your buy/sell signals fire into.
- Intelligence Layer: The AI Signal Classifier that grades every signal.
- Dashboard Layer: Real-time trend strength, volatility, volume sentiment, and market compression metrics.
Preset Profiles:
Trend Trader, Scalper, Swing, and Contrarian presets modify internal parameters and visual components in one click. The Scalper preset increases sensitivity for fast intraday timeframes; the Swing preset reduces it for daily/weekly charts. New users can use a preset immediately; advanced users can fine-tune individual parameters within each preset.
Non-repainting: Signal classification and placement occurs on confirmed bar closes. The Autopilot parameter optimization looks backward at closed bars only. Historical buy/sell signals do not move.
Available at quantzee.com/indicators/ai-adaptive-quant-toolkit/ — part of the Quantzee suite.
#3: SuperTrend Fusion — Multi-Timeframe Buy/Sell with Strength Dashboard
SuperTrend Fusion layers multi-timeframe analysis onto the core buy/sell signal framework, adding a live Market Strength Dashboard (a 0–100 score that quantifies the energy behind a move) and explicit Buy/Sell/Exit markers directly on the chart.
The distinction from SuperTrend Pro+: Fusion’s strength score gives you a real-time read on whether the trend behind your buy/sell signal has genuine momentum (score above 70) or is running on low energy (below 40). This is particularly useful for knowing when to hold a signal through a temporary retracement versus when the trend has actually exhausted.
Available at quantzee.com/indicators/supertrend-fusion/.
#4: LuxAlgo — Popular Premium Suite with Buy/Sell Labels
LuxAlgo is one of the most widely subscribed paid TradingView indicator suites, offering proprietary buy/sell signal generation across several of their indicator products. LuxAlgo focuses on Smart Money Concepts integration, with buy/sell signals tied to institutional order flow concepts (order blocks, fair value gaps, liquidity sweeps).
LuxAlgo is a capable product for traders who want a smart-money conceptual framework baked into their signals. The main consideration: price points are significantly higher than Quantzee’s flat-subscription model, and Smart Money Concepts indicators require more context to use correctly — a wrong-directional buy signal at an order block in a larger downtrend can still be a losing trade.
#5: AlgoAlpha — Strong Visualization with Buy/Sell Markers
AlgoAlpha offers well-designed buy/sell signal indicators on TradingView with good visual clarity. AlgoAlpha’s published scripts on TradingView’s public library show their approach to multi-timeframe confluence and signal grading.
Worth evaluating for traders who prioritize visual presentation and want signals that integrate tightly with TradingView’s native alert system.
Free Community Picks (Use With Caution)
The TradingView public library contains thousands of buy/sell signal scripts. A few are genuinely useful; the majority repaint or have been optimized specifically on the visible historical period. Run the Bar Replay test on any community script before using it with real capital.
The TradingView buy-sell scripts library is the starting point for exploring community options.
Comparison Table: Buy/Sell Indicators for TradingView 2026
| Indicator | Non-Repainting | Chop Filter | Auto TP/SL | MTF Dashboard | Alerts | Price |
|---|---|---|---|---|---|---|
| SuperTrend Pro+ (Quantzee) | Yes | Dual confluence | Yes (3-level ATR ladder) | Yes (5 TF) | Yes (4) | $9.99/mo |
| AI Adaptive Quant Toolkit | Yes | Autopilot + classifier | SmartTrail (adaptive) | Yes | Yes | $9.99/mo |
| SuperTrend Fusion | Yes | MTF alignment | Exit markers | Yes (strength score) | Yes | $9.99/mo |
| LuxAlgo | Yes | SMC-based | Partial | Yes | Yes | $49.99/mo+ |
| AlgoAlpha | Yes (most) | Signal grading | No | Yes (some) | Yes | $29/mo+ |
| Built-In SuperTrend (Free) | Yes | None | No | No | Yes | Free |
| EMA Crossover (Free) | Yes | None | No | No | Yes | Free |
| Community Scripts (Free) | Varies (often no) | Varies | Varies | Varies | Varies | Free |
How to Add a Buy/Sell Indicator to TradingView (Step-by-Step)
Adding Any Indicator from the Library
- Open any chart on TradingView.
- Click the “Indicators” button in the top toolbar (the icon with three overlapping lines and a magnifying glass), or press ”/” on your keyboard.
- In the search box that appears, type the indicator name (e.g., “SuperTrend” or “SuperTrend Pro+”).
- Click the indicator to add it to your chart. Free built-in indicators appear immediately; paid or invite-only indicators require either a TradingView plan or a third-party subscription that includes TradingView access.
- Once loaded, click the gear icon next to the indicator name in the chart pane to open settings. Adjust parameters (ATR period, multiplier, etc.) to your trading timeframe.
Adding a Premium Indicator (Invite-Only)
For invite-only indicators like Quantzee’s suite:
- Subscribe to Quantzee at quantzee.com/pricing/.
- Quantzee’s system grants your TradingView account access to all indicators (linked via your account email).
- On TradingView, search for “Quantzee” in the Indicators search — the suite appears under the “Invite-Only Scripts” section.
- Add any indicator to your chart. If you see “Request Access” instead of an add button, confirm your TradingView username matches what you registered with Quantzee.
Configuring Buy/Sell Signals
Most buy/sell indicators have an option to show or hide the signal labels (arrows/text) separately from the underlying trend visualization. In SuperTrend Pro+:
- Toggle “Show Long Signal” and “Show Short Signal” in the indicator settings to display or hide the buy/sell labels.
- Adjust “Fast ATR Period” and “Fast ATR Factor” for the fast SuperTrend; similarly for the slow. Tighter factors = more signals; wider factors = fewer, higher-confidence signals.
- The confidence zone shading adjusts automatically.
Automating Buy/Sell Alerts: From TradingView to Executed Orders
TradingView’s native alerts are powerful: when an indicator’s alert condition triggers, TradingView can send notifications via email, push notification to your mobile, webhook URL, or SMS. For traders who want to move beyond manual monitoring to automated execution, the webhook path is what matters.
Step 1: Set Up the Alert in TradingView
- On a chart with your buy/sell indicator loaded, click the “Alerts” icon (bell) in the right sidebar.
- Click “Create alert.”
- Under “Condition,” select your indicator from the dropdown (e.g., “SuperTrend Pro+”) and then select the specific alert condition (e.g., “Long Confluence Signal”).
- Under “Notifications,” enable “Webhook URL” and enter your webhook endpoint.
- In the “Message” box, enter the order payload your automation platform expects.
- Set the trigger to “Once per bar close” for confirmed, non-repainting signals. (Never use “Once per bar” or “Per bar open” with buy/sell signals — this fires on unconfirmed intrabar data and may trigger on signals that do not hold.)
Step 2: Route Alerts to Your Execution Platform
SignalStack: SignalStack is the most widely used TradingView alert-to-order automation platform, supporting 33+ brokers and exchanges. You create a webhook in SignalStack, configure the order action for buy signals and separately for sell signals, and paste the SignalStack webhook URL into your TradingView alert. SignalStack routes the alert to your connected broker in under 0.45 seconds. Detailed setup: SignalStack TradingView Alerts guide.
Alertatron: Similar webhook-based automation for TradingView. Supports crypto exchanges more broadly than SignalStack and handles more complex order types (including position management logic — scaling in, scaling out, bracket orders). Good choice for crypto traders who want sophisticated position management triggered by buy/sell signals.
Direct Webhook Integration: If your broker supports webhook-based order entry (many algo-friendly brokers do), you can POST directly from TradingView to your broker’s API endpoint. This requires configuring the alert message payload to match your broker’s expected JSON format.
What to Set in the Alert Message
The alert message payload needs to tell your execution system which action to take. A typical SignalStack payload for a buy signal from SuperTrend Pro+:
{{ticker}} buyFor a sell:
{{ticker}} sellMore complex payloads can include position size, order type, and stop-loss parameters. TradingView placeholders like {{ticker}}, {{close}}, {{volume}}, and {{time}} are available to make payloads dynamic.
Critical note: Automate only signals you have tested extensively in paper trading first. A buy/sell signal that looks great manually may behave differently at execution speed when dealing with real fills, slippage, and rapid market conditions. Always run at least four weeks of paper automation before going live.
Best Buy/Sell Indicator by Asset Class
Different markets have different structural characteristics. Here is how to calibrate your buy/sell indicator choice and settings by the market you trade.
Best Buy/Sell Indicator for Stocks (Equities)
For US equities, the session structure heavily influences signal quality. The highest-quality buy/sell signals tend to occur in the first 90 minutes after the NYSE open (9:30–11:00 AM ET) and in the final 30 minutes before close — these are the highest-volume periods where directional moves have genuine follow-through.
Recommended approach: SuperTrend Pro+ on the 5-minute or 15-minute chart, filtered by VWAP (built-in, free). Take buy signals only when price is above VWAP; take sell signals only when price is below VWAP. This adds an institutional-order-flow filter that the SuperTrend logic alone cannot provide.
For Investopedia’s overview of technical analysis for equities: the combination of trend, momentum, and volume context is consistently cited as more reliable than single-factor signals.
Best Buy/Sell Indicator for Crypto
Crypto’s 24/7 trading cycle creates a specific challenge for buy/sell indicators: the concept of a “session” is fluid, and volatility regimes can shift dramatically between high-volume periods (US/EU session overlap) and low-volume weekend periods.
The adaptive advantage: The AI Adaptive Quant Toolkit’s Autopilot engine is particularly well-suited to crypto because its self-tuning parameters adjust to volatility regime changes without manual intervention. Static ATR parameters that work during Tuesday afternoon on BTC/USDT will generate excessive false signals on a quiet Sunday at 3:00 AM UTC. The Toolkit adjusts automatically.
Setting: For crypto, the Scalper or Trend Trader preset depending on your timeframe. On 4H–Daily charts, use Trend Trader. On 1H and below, Scalper.
Best Buy/Sell Indicator for Forex
Forex buy/sell signals are most reliable during major session overlaps: London open (3:00–5:00 AM ET), and the London–New York overlap (8:00–11:00 AM ET). These periods produce the highest liquidity and the most directional moves on major pairs.
Session-aware configuration: SuperTrend Pro+ on the 5-minute EUR/USD with ATR Period 10, Factor 2.0 during the London–New York overlap. Avoid trading buy/sell signals on major pairs during the Asian session (Sunday night to early Monday US time) when spreads are wider and liquidity is thin.
For Investopedia’s explanation of forex market hours: understanding the session structure is as important as the indicator selection for forex signal reliability.
Best Buy/Sell Indicator for NIFTY and Indian Indices
NIFTY 50 and Bank NIFTY have specific characteristics that affect buy/sell indicator behavior:
- Trading hours: 9:15 AM to 3:30 PM IST. No overnight session.
- The 9:15–10:15 AM period is the highest-volatility window — buy/sell signals here require more confirmation because spreads are wider and price can reverse sharply.
- The NSE (National Stock Exchange of India) and SEBI (Securities and Exchange Board of India) guidelines on algorithmic trading apply to automated execution of signals.
Recommended approach: SuperTrend Pro+ on the 5-minute or 15-minute NIFTY chart. The dual-confluence system handles the morning volatility better than single SuperTrend because it does not fire signals on every ATR flip — the slow SuperTrend acts as a filter that suppresses signals when the faster timeframe is whipping back and forth in the early session.
For index options traders: CPR ThetaEdge (quantzee.com/indicators/cpr-theta-edge/) is specifically designed for NIFTY/BANKNIFTY options strategy rather than raw buy/sell directional entries.
Free vs. Paid: Making the Honest Comparison
Paid buy/sell indicator subscriptions typically run $10–$50 per month. Whether that cost is worth it comes down to a few honest questions.
What you get with paid indicators:
- Multi-confluence logic that significantly reduces false signals (the most valuable feature — time and capital saved from not trading bad setups).
- Automatic parameter optimization that removes manual tuning burden.
- Built-in trade-level calculation (TP/SL) that removes execution ambiguity.
- Multi-timeframe dashboards that add structural context.
- Reliable non-repainting guarantees with transparent methodology.
- Customer support and ongoing development.
What you can achieve with free indicators:
- A SuperTrend (free built-in) + RSI (free built-in) + VWAP (free built-in) setup covers the three-layer signal stack at zero cost. It requires manual parameter management, manual divergence detection, and manual context reading — but it works.
- The free setup produces more false signals and requires more experience to filter them correctly. The learning curve is steeper.
The honest math: If a paid indicator that costs $9.99/month helps you avoid two losing trades per month that would each have cost 1% of your account on a $5,000 account — that is $100 saved per month against a $9.99 cost. The R-multiple is overwhelmingly positive. The same math does not apply to all traders: if you trade very small size or very infrequently, the cost-benefit is different.
Our guide to TradingView indicator subscription ROI walks through a rigorous framework for calculating whether any paid subscription pays for itself in your specific setup.
Common Mistakes With Buy/Sell Indicators
Mistake 1: Using a repainting indicator. The most costly mistake. If you skipped directly to the ranked list above without reading the repainting section — go back and read it now. Every recommendation in this guide is based on verified non-repainting behavior. Do not apply the same trust to arbitrary community scripts.
Mistake 2: Treating every signal as a trade. No buy/sell indicator should be used without context. A buy signal in a confirmed weekly downtrend is a counter-trend entry. A buy signal at a key resistance level carries different risk than one at support. Context determines whether a technically valid signal is worth acting on.
Mistake 3: Not accounting for spread and commissions. A buy/sell indicator that produces 0.5% average gain per signal in backtesting before costs may barely break even after a 0.1–0.2% round-trip spread (or commission). Run every backtested strategy on post-cost figures. For a complete breakdown of how to set commission, slippage, and out-of-sample testing correctly, see our TradingView backtesting guide.
Mistake 4: Trading news events. Economic releases — CPI, NFP, FOMC decisions, earnings — invalidate all technical setups for the duration of the event. Buy/sell signals that fire 5 minutes before a major news event have a much lower hit rate than baseline. Stop trading 15 minutes before and 15 minutes after scheduled high-impact events.
Mistake 5: Using too many buy/sell indicators simultaneously. Adding a second buy/sell indicator that uses similar underlying logic does not add information — it adds noise. Two SuperTrend variants produce correlated signals, not independent confirmation. If you want true multi-confirmation, the two layers need to measure genuinely different things (e.g., trend direction from SuperTrend + momentum from RSI, not SuperTrend from two timeframes).
Mistake 6: Entering after the signal bar has moved. A SuperTrend Pro+ buy signal fires on bar close. If the next bar opens 20 pips above the signal bar’s close, the original entry is gone — the risk-reward ratio has shifted. Chasing signals by entering one or two bars late is a consistent way to enter at the worst possible point. If you missed the entry, wait for the next setup.
Frequently Asked Questions
Conclusion: The Buy/Sell Indicator That Works in Live Trading
The buy/sell indicator market on TradingView in 2026 ranges from powerful, rigorously built tools to flashy community scripts that will never produce the results their historical charts suggest. The single filter that separates the useful from the useless is non-repainting behavior — and you can verify it yourself in five minutes with Bar Replay.
Among verified non-repainting buy/sell indicators, the practical differentiation comes from chop filtering (how effectively the indicator avoids false signals in ranging markets), trade-level automation (whether it gives you TP/SL with every signal or just the arrow), and multi-timeframe context (whether the signal accounts for higher-timeframe trend structure).
SuperTrend Pro+ covers all three for most traders: dual-confluence chop filtering, automatic three-level ATR ladder, and a five-timeframe MTF dashboard. The AI Adaptive Quant Toolkit adds self-tuning parameters and AI signal classification for traders who want the system to adapt to market conditions automatically.
Both are part of the complete Quantzee suite at $9.99/month — a flat subscription that includes all thirteen indicators, a 14-day money-back guarantee, and TradingView access the same day you subscribe.
Explore Quantzee Indicators
- SuperTrend Pro+: Dual-Confluence Buy/Sell Signals
- AI Adaptive Quant Toolkit: Self-Tuning Signal System
- SuperTrend Fusion: Multi-Timeframe Buy/Sell with Strength Score
- Full Indicator Suite + Pricing
Related Articles
- Best TradingView Indicators 2026: Ranked and Reviewed
- Best Scalping Indicator for TradingView 2026
- Non-Repainting TradingView Indicators: Complete Guide
- How to Test Any TradingView Indicator for Repainting
- SuperTrend Fusion: Most Profitable Signals Guide
- How to Choose a TradingView Signal Tool
Authority References
- TradingView Pine Script — Repainting Documentation — Official TradingView documentation on why indicators repaint and how to avoid it.
- Investopedia: Technical Indicators Overview — Core concepts behind technical indicator construction and use.
- Investopedia: Algorithmic Trading — How algorithmic and automated signal execution works.
- SignalStack: TradingView Alert Automation — The leading platform for automating TradingView buy/sell alerts into executed orders.
- NSE India: Index Specifications — Official NIFTY and Bank NIFTY contract and trading specifications.
- SEBI: Algorithmic Trading Guidelines — India’s regulatory framework for automated and algorithmic trading.
Educational Disclaimer: All content in this article is for informational and educational purposes only. Quantzee indicators are analytical software tools designed for chart analysis — not personalized financial advice, not investment recommendations, and not a guarantee of any trading result. Buy/sell signals generated by technical indicators reflect pattern recognition on historical price data and do not predict future market movement. Always conduct your own research, consult a qualified financial advisor where appropriate, and apply your own risk management rules before making any trading decision.