The best supertrend indicator TradingView traders can run isn’t the stock Supertrend that ships with the platform — it’s a Supertrend that knows when to stay quiet. Classic Supertrend is brilliant in a clean trend and brutal in a range. One independent study of 4,052 backtested trades across 307 years of exchange data found the standard daily Supertrend won just 43% of the time, with 58% of trades closing red. That single number explains why most traders quit on it. SuperTrend Fusion exists to fix the exact weakness behind that statistic.
This guide breaks down how the original indicator actually works, the settings that matter by trading style, the precise reason it whipsaws, and how the Fusion approach turns a noisy single line into higher-conviction signals you can trade with rules instead of guesswork.
Disclaimer: This article is for educational and informational purposes only. Quantzee’s indicators are analytical software tools, not financial advice. Past signal performance on historical charts does not guarantee future results. Always apply your own risk management and do your own research before making any trading decision.
What the Supertrend indicator really measures
Supertrend was created by French trader Olivier Seban in 2009. It is a trend-following overlay built entirely on the Average True Range (ATR) — the same volatility yardstick that powers Keltner Channels and many stop-loss models. The math is short:
- Midpoint = (High + Low) / 2
- Upper Band = Midpoint + (Multiplier × ATR)
- Lower Band = Midpoint − (Multiplier × ATR)
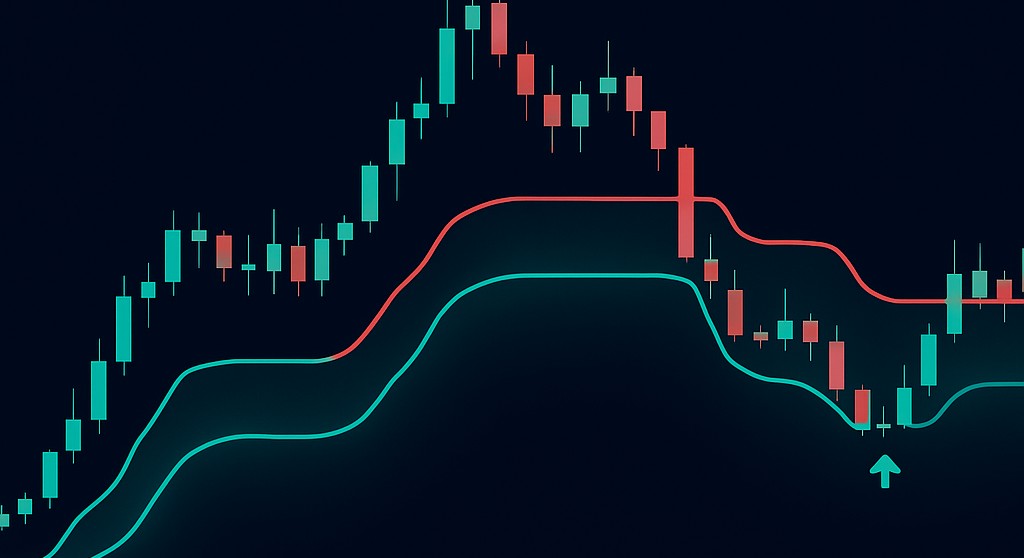
The line flips sides based on the close. When price closes above the upper band, the Supertrend snaps below price and turns green — a long signal. When price closes below the lower band, it jumps above price and turns red — a short signal. A worked example makes it obvious: if the midpoint is 100 and ATR × Multiplier equals 6, the upper band sits at 106 and the lower band at 94. A close at 108 flips the line green; a later close at 90 flips it red.
Two things follow from this design. First, Supertrend is a lagging indicator — it reacts to volatility that already happened rather than predicting the next move. Second, because the bands are anchored to ATR, the indicator is only as stable as the volatility regime it sits in. Calm, directional markets keep the line on one side for weeks. Choppy markets flip it every few candles.
Best Supertrend indicator settings for TradingView by style
Supertrend has exactly two knobs: the ATR length (how many candles feed the volatility average) and the multiplier (how far the bands sit from price). Smaller numbers react faster and fire more signals — and more false ones. Larger numbers filter noise but arrive late. TradingView’s default is (10, 3): a 10-period ATR with a 3× multiplier. That default is a swing-trading compromise, not a universal answer.
Here is how active desks typically tune it:
- Scalping (1–5 min): (7, 2) — fast response for quick in-and-out trades.
- Intraday (5–15 min): (7–10, 2–3) — balanced; catches most of the session’s moves.
- Swing (daily): (10–14, 3–4) — smoother, fewer whipsaws across multiple days.
- Position (weekly): (14, 4) — very stable, tuned for long-term trends.
- Crypto: push the multiplier up (often 3–4 even intraday) because volatility runs hot.
There is no single “magic” setting, and that’s the honest takeaway. The same (10, 3) that behaves beautifully on a trending Nasdaq daily can shred an account on a sideways forex 15-minute chart. Settings have to follow the timeframe, the asset’s volatility, and your hold time.
Why classic Supertrend whipsaws — and loses money in isolation
The 43% win rate above isn’t a fluke of one backtest. It’s structural. Supertrend has no concept of context. It cannot tell a strong directional breakout from a low-volatility chop where price keeps brushing the line. In range-bound conditions the line flips color repeatedly, handing you a long at the top of the range and a short at the bottom — the worst possible sequence. Every guide that tests it honestly arrives at the same verdict: never trade Supertrend alone.
The standard fix is to add confirmation filters. The most common pairings are ADX (to confirm the trend is actually strong enough to follow), a moving average (to define the higher-timeframe direction), RSI (to avoid buying into exhaustion), and VWAP (for intraday mean-reference). The logic is simple — only take the green flip when ADX says a trend exists, only take longs above the 200-period average, skip signals when price is coiling near the line. The problem is that stacking four indicators by hand, candle by candle, across stocks, crypto, forex and indices is slow and inconsistent. That’s the gap SuperTrend Fusion closes.
How SuperTrend Fusion produces higher-conviction signals
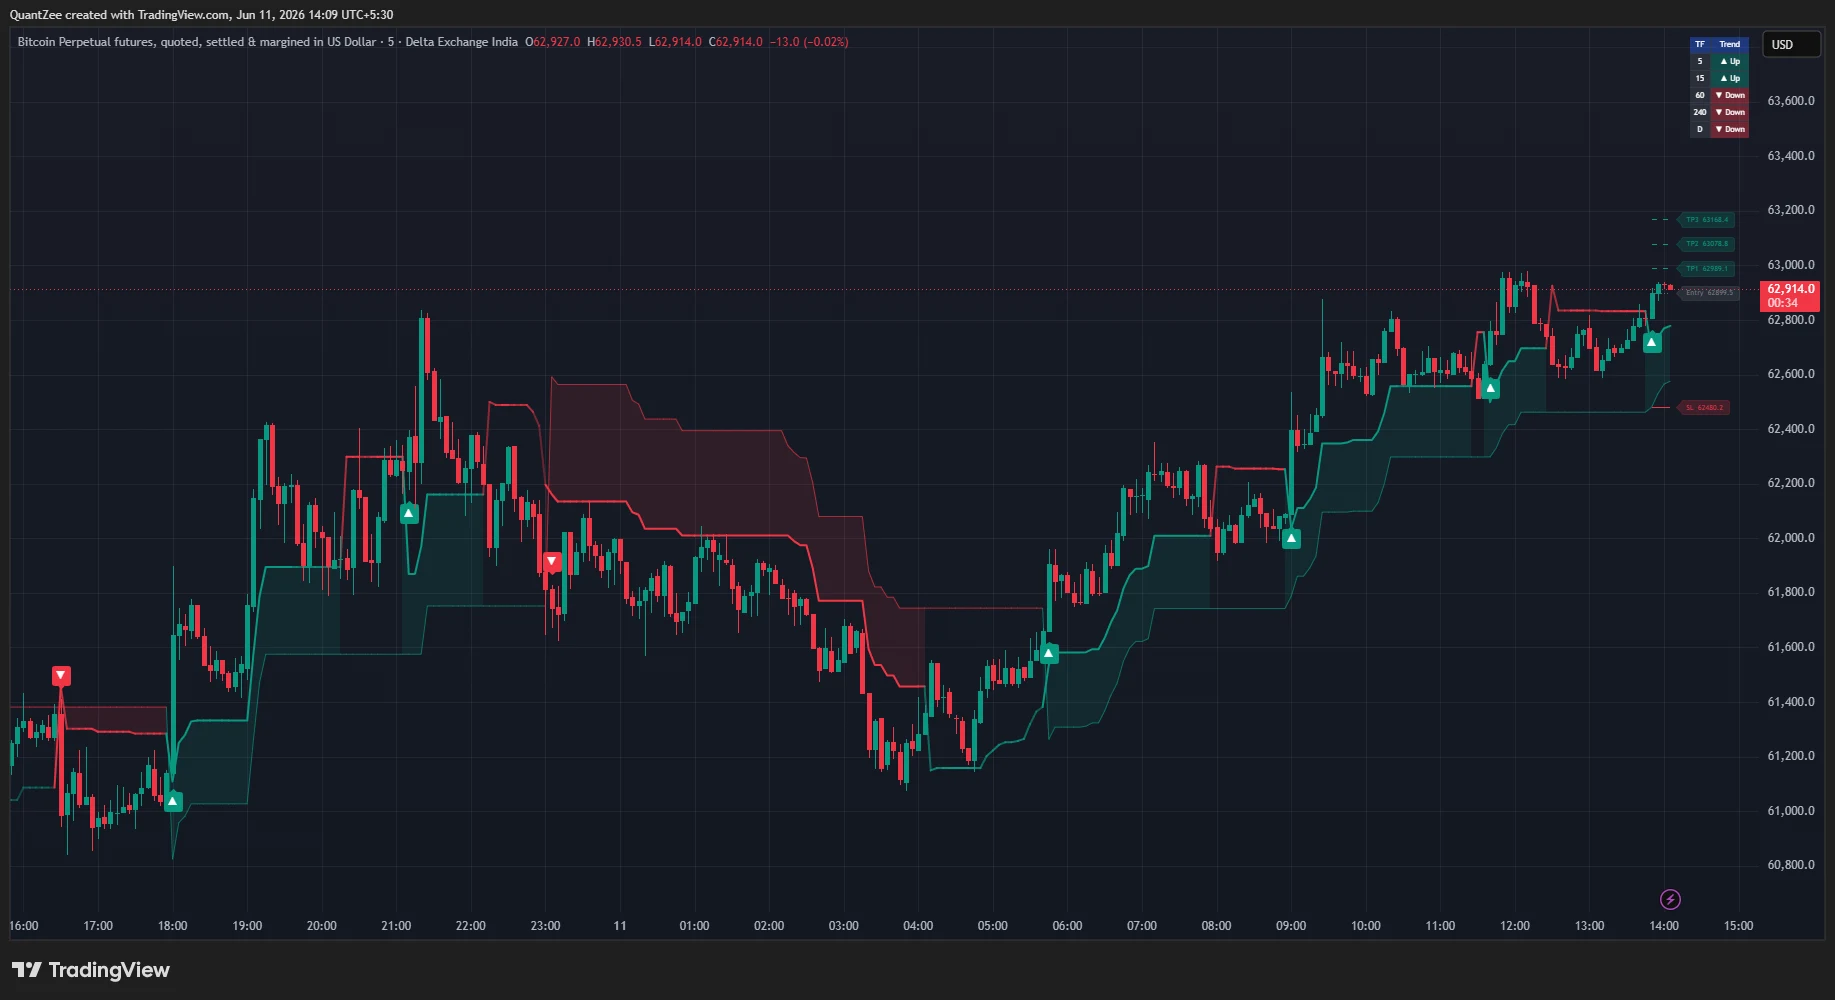
SuperTrend Fusion is one of Quantzee’s AI-powered TradingView indicators, and it is built specifically around the weakness in the classic line. Instead of flipping on a single ATR band cross, Fusion “fuses” the Supertrend trend state with volatility regime detection and momentum confirmation before it prints a signal. The result is fewer alerts, but each one carries more context behind it.
Three design choices matter most:
- Non-repainting signals. A signal that appears on the closed candle stays there. Many “accurate” Supertrend mods on TradingView repaint — they redraw history so the chart looks perfect in hindsight but the live alert was different. Fusion’s signals are fixed once the candle closes, so a backtest reflects what you’d actually have traded. See our full guide on non-repainting TradingView indicators for why this matters.
- Regime awareness. Fusion is designed to suppress the range-bound flips that destroy the classic line’s win rate, only flagging trend continuation and reversal signals when the underlying volatility and momentum agree.
- Multi-market, real-time alerts. The same logic runs on stocks, crypto, forex and indices, with real-time alerts so you don’t have to babysit the chart waiting for a flip.
You can see the full signal logic, example charts, and the supported markets on the SuperTrend Fusion indicator page. If you want to compare it against the rest of the toolkit, the complete lineup lives on the Quantzee indicators overview.
A rule-based way to trade Supertrend signals
Whether you run the classic line or Fusion, signals only make money inside rules. A simple, mechanical framework:
- Define direction first. Only take long flips when price is above its higher-timeframe trend reference; only take short flips when it’s below. This alone removes most counter-trend whipsaws.
- Require a confirmation. Don’t act on color alone — wait for the regime/momentum filter (or ADX above ~20–25) to agree.
- Place the stop at the line. The Supertrend line itself is a logical, volatility-adjusted stop. If it flips against you, the trade thesis is invalid.
- Pre-set the exit. Trail the stop with the line, or take partial profit at a fixed R-multiple. Mechanical exits beat discretionary ones over a sample of trades.
- Skip the chop. If price is hugging the line and the filter is flat, there is no trade. The discipline to do nothing is where the edge actually lives.
Backtest any setting on your own market and timeframe before you risk capital. A configuration that prints clean signals on BTC’s daily chart can behave completely differently on EUR/USD at 5 minutes. For a deeper dive into settings for specific markets, read our SuperTrend indicator settings guide.
Related resources
- SuperTrend Fusion indicator page — live signals, feature breakdown, supported markets
- Full Quantzee indicator lineup — all 12 AI-powered tools
- SuperTrend indicator settings guide — optimized settings for crypto, Gold, forex, and intraday
- Non-repainting TradingView indicators — why repainting kills live performance
- Quantzee pricing — plans starting at $9.99/month
Frequently Asked Questions
What is the best Supertrend setting on TradingView?
There is no universal best setting. TradingView’s default is (10, 3) — a 10-period ATR with a 3× multiplier — which suits daily swing trading. Scalpers commonly use (7, 2), intraday traders (7–10, 2–3), and position traders (14, 4). The right setting depends on your timeframe, the asset’s volatility, and your hold time.
Is the Supertrend indicator actually profitable?
Not on its own. One independent study of 4,052 backtested trades across 307 years of data found the standard daily Supertrend won only about 43% of the time, with 58% of trades losing. It can be profitable when combined with trend and momentum filters — which is exactly the problem SuperTrend Fusion is built to solve.
Why does my Supertrend keep giving false signals?
Because classic Supertrend has no sense of market context. In sideways, range-bound conditions price repeatedly brushes the ATR band, flipping the line green and red every few candles. These whipsaws are the indicator’s single biggest weakness, which is why you should skip signals when price is coiling near the line.
What does "non-repainting" mean and why does it matter?
A non-repainting signal stays fixed once the candle closes — it doesn’t redraw history. Many Supertrend mods repaint, making backtests look perfect in hindsight while the live alert was different. SuperTrend Fusion’s signals lock on candle close, so what you backtest is what you would actually have traded.
How is SuperTrend Fusion different from the standard Supertrend?
The standard line flips on a single ATR band cross. SuperTrend Fusion fuses the trend state with volatility-regime detection and momentum confirmation before printing a signal, suppressing the range-bound flips that hurt the classic line. It also offers non-repainting signals and real-time alerts across stocks, crypto, forex, and indices.
Who invented the Supertrend indicator?
French trader Olivier Seban created it in 2009. It is a trend-following overlay based on the Average True Range (ATR), which combines trend direction and volatility into a single plotted line.
Which indicators should I pair with Supertrend?
The most common confirmations are ADX to verify trend strength, a moving average to set higher-timeframe direction, RSI to avoid buying exhaustion, and VWAP for an intraday reference. SuperTrend Fusion automates this multi-factor confirmation so you don’t have to stack and read four indicators manually.
Can I use SuperTrend Fusion for crypto and forex?
Yes. The same signal logic runs on stocks, crypto, forex, and indices. Because crypto runs hotter volatility, a higher multiplier is generally appropriate; Fusion’s regime awareness is designed to adapt to those conditions across markets.
Classic Supertrend gave traders a clean idea wrapped around a fragile execution. SuperTrend Fusion keeps the idea and replaces the fragility with confirmation and non-repainting discipline. Explore the live signals and supported markets on the SuperTrend Fusion page and see how rule-based, AI-confirmed signals change the way you trade trends.