OverCharts and Quantzee serve different traders — OverCharts is order-flow analysis software for futures traders ($80-130+/mo with data feeds), Quantzee is a signal-overlay suite for TradingView chart traders, sold for one payment of $59.99. They are not interchangeable.
Two types of traders look at the same problem differently. The first wants every byte of order flow data: Volume Profile, TPO charts, DOM ladder, depth-of-market, tick-by-tick replay — the raw machinery of how price forms in the auction. The second wants clarity: a signal with a stop-loss level and a take-profit target, immediately actionable on any chart. Overcharts is built for the first type. Quantzee is built for the second. Understanding which one you are — and why — is the actual choice on this page.
⚡ Key Takeaways
- Overcharts costs $24.95–$40/month for the subscription alone — but real-time data feeds (Rithmic, CQG, Interactive Brokers) add $50–100/month on top, putting the true effective cost at $80–130/month or more.
- Overcharts provides raw order flow data (Volume Profile, DOM, TPO charts) but generates no built-in trade signals — all signal interpretation is entirely manual and requires significant order flow expertise.
- Quantzee delivers structured AI signals with entry levels, stop-loss, and take-profit targets directly on TradingView for one $59.99 payment — covering all markets, with no separate data feed costs and no renewal.
- Quantzee's non-repainting signal quality is testable on any TradingView chart before you buy, using the Bar Replay method — and the Pine Script source is emailed to you afterwards.
- Overcharts is a Windows-only desktop application; Quantzee runs on TradingView in any browser on any device, making it fully platform-agnostic.
Top 4 Alternatives to OverCharts in 2026 (Quick Comparison)
If you’re comparing OverCharts against the field rather than just against one competitor, here’s where it sits relative to the other tools traders in this category most often shortlist:
| Rank | Tool | Category | Starting Price | Notable Limitation / Fit |
|---|---|---|---|---|
| 🏆 1 | Quantzee | AI signal indicators (TradingView) | $59.99 once — Pine source emailed, no renewal | Non-repainting, verifiable on Bar Replay, covers crypto, stocks, forex & commodities |
| 2 | OverCharts | — | $80–$130+/mo | order-flow data platform, steep learning curve |
| 3 | FluxCharts | Related tool in this category | See full comparison | Different feature/price tradeoff — worth shortlisting alongside OverCharts |
| 4 | LuxAlgo | Related tool in this category | See full comparison | Different feature/price tradeoff — worth shortlisting alongside OverCharts |
Quantzee tops this list on price-to-signal-clarity ratio — $59.99 paid once against OverCharts’s $80–$130+ every month, with non-repainting logic you can verify yourself before paying. The detailed, feature-by-feature comparison against OverCharts specifically follows below.
What Is Overcharts?
Overcharts is a professional desktop trading and charting platform built around order flow analysis. Its core audience is institutional and professional retail traders who use Volume Profile, TPO (Time Price Opportunity) charts, and DOM (Depth of Market) as their primary analytical methodology. It competes with platforms like NinjaTrader and Sierra Chart rather than with indicator suites on TradingView. For context on what order flow trading involves, Investopedia’s overview of order flow explains the foundations.
What Overcharts does well
Volume Profile and TPO analysis: Overcharts has a strong reputation among order-flow traders for the quality of its Volume Profile implementation — Point of Control, Value Area High/Low, and developing TPO charts that update in real time. These tools help traders identify price levels where the largest volume has traded, which many professionals use as magnetic support and resistance levels.
DOM (Depth of Market): The DOM ladder in Overcharts gives traders a real-time view of pending orders at each price level, which scalpers and active futures traders use to assess short-term buying and selling pressure.
Multi-workspace, multi-instrument layouts: Overcharts supports running many charts and data windows simultaneously with minimal performance degradation — a practical requirement for traders monitoring multiple futures contracts or currency pairs at once.
Direct broker integration: Unlike most TradingView-based tools, Overcharts connects directly to supported brokers and data feeds, allowing analysis and execution from within the same platform. This tight integration is valuable for high-frequency manual traders.
Data feed ecosystem: Overcharts works with data providers including CQG, Rithmic, and Interactive Brokers, which provide the tick-level and order-book data that order flow analysis requires. TradingView does not offer this resolution of data.
Who uses Overcharts in practice?
Based on community discussions on trader forums, Reddit’s r/Daytrading and r/Futures communities, and the Overcharts own forum, the typical Overcharts user is:
- A futures trader (ES, NQ, Crude, Bonds) who specifically needs tick data and order book access
- An experienced professional or semi-professional trader who is comfortable with a complex desktop application
- A trader running a dedicated trading machine (Windows, multiple monitors) rather than a web-based workflow
This is a narrow but real audience. For those traders, Overcharts provides genuine capability that TradingView simply cannot match.
Why traders look for Overcharts alternatives
Despite its depth, a significant share of traders evaluate Overcharts and then look elsewhere. The most common reasons:
True cost is higher than the subscription price
Overcharts’ subscription price ($24.95–$29.95/month billed annually, or $40/month on a rolling monthly plan) is only part of the picture. Real-time institutional data feeds — Rithmic, CQG, Interactive Brokers — add meaningful cost on top. For traders outside North America, currency conversion and premium exchange fees increase the effective cost further.
A trader paying $30/month for Overcharts plus $50–100/month for a quality data feed is looking at $80–130/month total — more than most retail indicator suites.
Setup is genuinely complex
Getting Overcharts fully operational requires: finding a compatible broker, setting up the right data feed subscription, configuring the connection within the platform, optimising chart layouts, and learning a non-trivial UI. Community posts regularly show new users spending a week or more getting the technical stack working before they can trade. This is not a criticism of the platform — it is a description of what the product is. But it means the time cost of adoption is real.
Order flow requires skill to apply
Volume Profile and DOM are legitimate analytical frameworks used by professional traders. They are also frameworks that require significant study and live market experience to apply correctly. Identifying whether a high-volume node is acting as support or resistance, or reading DOM for hidden institutional activity, is not a skill that comes from the software — it comes from experience. Overcharts gives you the tools; it does not teach you when to use them or what to do when the signal is ambiguous.
This is a structural gap: Overcharts provides raw data of high quality, but no signals, no entry guidance, and no risk management output. You are entirely responsible for translating the data into a trade.
Primarily a desktop Windows application
Overcharts is a Windows desktop application. Traders who work across devices, prefer web-based workflows, or use macOS without a Windows VM find this a genuine constraint.
Overcharts pricing (2026)
- 30-day free trial: Available with all features
- All-Inclusive Annual Plan: Approximately $29.95/month billed annually
- Two Data-Feeds Annual Plan: Approximately $24.95/month billed annually
- Monthly Plan: $40/month (data feed still billed annually)
- Data feeds: Purchased separately from third-party providers — Rithmic, CQG, or Interactive Brokers
The monthly plan is more accessible, but the annual per-feed structure means you still commit to full-year data costs even on a flexible platform plan.
Overcharts pros and cons
Strengths:
- Genuinely professional-grade Volume Profile and TPO tools
- DOM ladder with real-time order book data
- Direct broker integration for analysis-to-execution in one platform
- Multi-workspace performance under heavy data loads
- 30-day free trial with full feature access
Limitations:
- No built-in trading signals — all signal generation is manual
- Data feed cost adds significantly to total monthly spend
- Windows-only desktop application
- Steep learning curve; appropriate for experienced order flow traders
- Not suitable for traders who want TradingView-compatible, cross-device workflows
What is Quantzee?
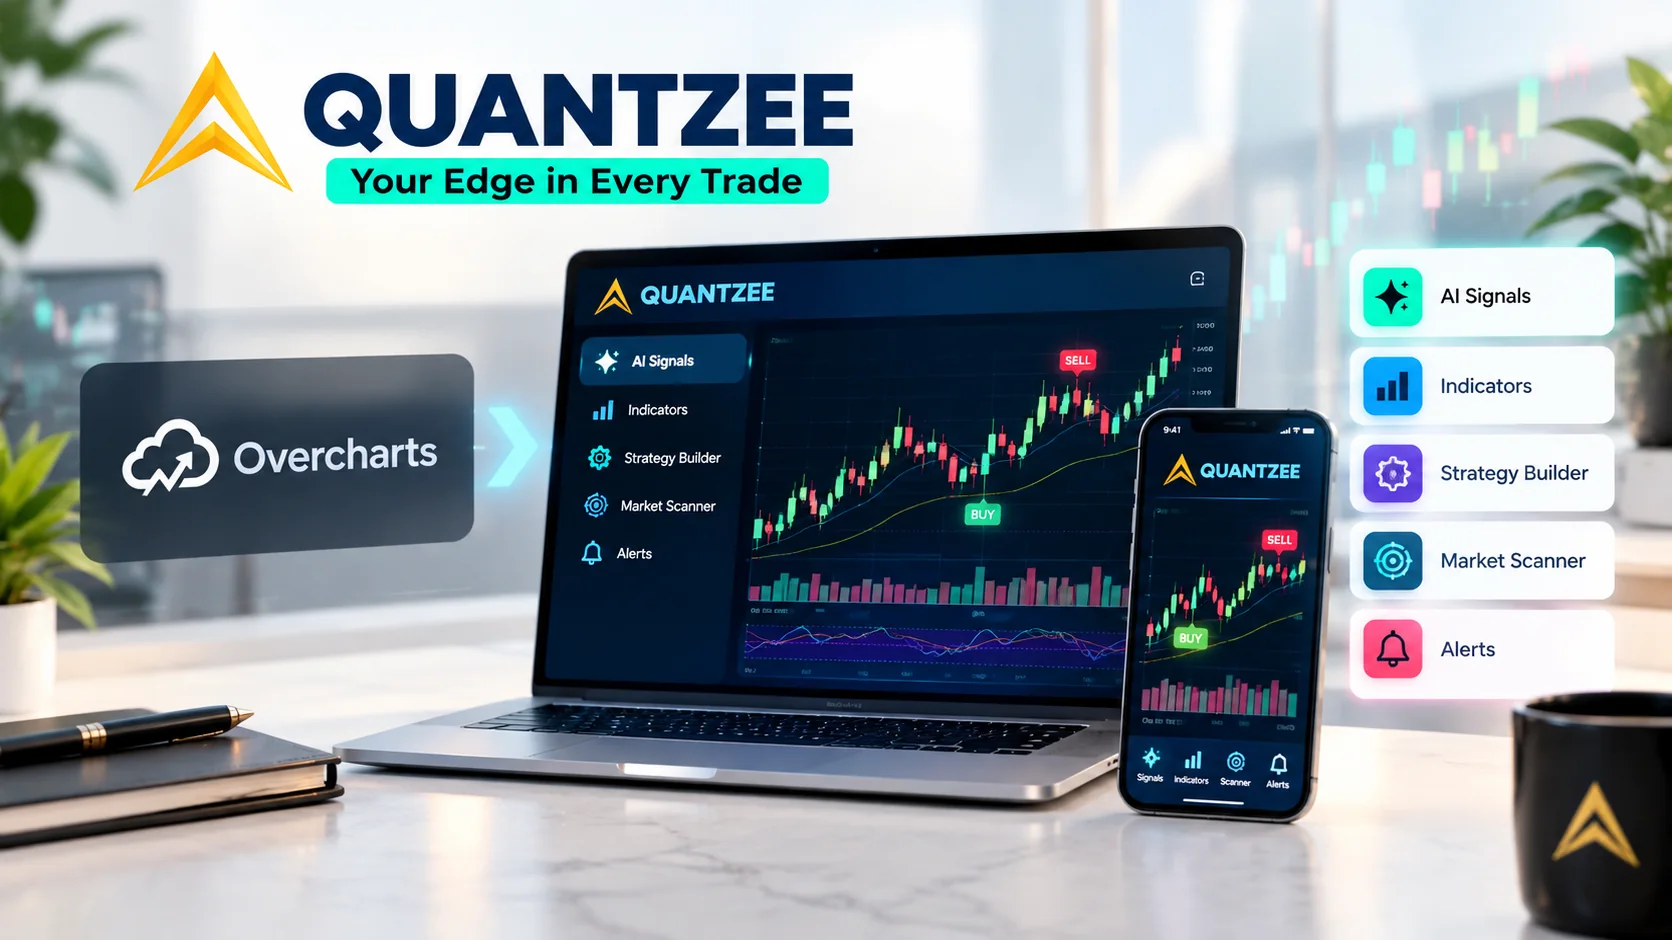
Quantzee is an AI trading indicator suite that runs directly on TradingView. Rather than providing raw market data for manual analysis, it outputs structured trading signals — entry levels, stop-loss zones, take-profit targets — visualised on the price chart, for any TradingView market.
The core philosophy is clarity over complexity: instead of giving you more data to interpret, it gives you fewer, better-filtered decisions, with the analytical reasoning visible on the chart through trend overlays, confidence dashboards, and dynamic level markers.
How Quantzee differs structurally from Overcharts
Signal output vs. data input: Overcharts gives you the raw data (Volume Profile, DOM, tick charts). Quantzee gives you the derived signal (trend direction, confidence level, SL/TP levels). One is upstream of the decision; the other is downstream of it.
TradingView web-based vs. Windows desktop: Quantzee runs in any browser on any device that supports TradingView — no installation, no data feed setup.
Non-repainting signals: Quantzee’s indicators lock their signals at bar close using forward-calculated logic. You can apply the repainting test (screenshot a signal, wait for several candles, check whether it changed) and the signal will be identical. This is a testable guarantee, not a marketing claim.
Cross-market coverage without extra cost: The Quantzee purchase works across stocks, forex, crypto, indices, and commodities on TradingView — all of it, once. Overcharts charges separately per data feed per market, every month.
Verify before you buy
Quantzee’s suite is entirely paid — $59.99 once, no free tier and no trial. Because the source code is emailed the moment you pay, the purchase is final, so verify the core claim yourself first:
- Add any Quantzee indicator to a chart on TradingView’s Bar Replay and check whether signals hold their position as new candles close (the non-repainting test).
That verification is free even though the subscription is not — it lets you confirm the signals behave as advertised before you commit.
If order flow isn’t your edge and you just want reliable, non-repainting signals on your existing TradingView charts, Quantzee’s one-off $59.99 skips the $50-100/mo data-feed tax entirely — and the software fee with it.
Quick comparison: Overcharts vs Quantzee
| Feature | Overcharts | Quantzee |
|---|---|---|
| Core Focus | Order flow, Volume Profile, DOM — raw data for manual analysis | AI-adaptive trading signals — filtered entry/SL/TP for actionable decisions |
| Signal Output | None built-in — trader interprets raw data | Built-in, non-repainting signals with SL/TP overlays |
| Platform | Windows desktop application | TradingView (web-based, any device) |
| Data Feeds | Required separately (Rithmic, CQG, IB) — extra cost | Included in TradingView data (free or paid TradingView plan) |
| Effective Monthly Cost | $25–30 subscription + $50–100 data feeds | $0 after the one-time $59.99 |
| Learning Curve | High — requires Volume Profile/DOM methodology knowledge | Low — signals visible on chart with context |
| Multi-Market Access | Per-feed subscription per market | All TradingView markets under one plan |
| Best For | Professional futures/equities order flow traders | Retail traders seeking clear, cross-market AI signals |
| Free Entry Point | 30-day full trial | No trial — one $59.99 purchase |
Who should use which tool?
Overcharts is the better choice if:
- You are an experienced futures trader who specifically needs DOM, tick-level data, and TPO charts as core methodology
- You have a dedicated Windows trading machine and a broker connection that supports Overcharts’ data feed options
- You already understand order flow and Volume Profile well and need the best desktop tool for executing that approach
Quantzee is the better choice if:
- You want structured signals (entry, stop-loss, take-profit) with the logic visible on your chart rather than raw data to interpret yourself
- You trade across multiple markets or asset classes and want one subscription covering all of them
- You work on TradingView and prefer a web-based, device-agnostic workflow
- You are earlier in your trading journey or prefer AI-adaptive signal generation over manual data reading
Conclusion
Overcharts and Quantzee are not really competing for the same trader. Overcharts is a professional-grade desktop tool for experienced order flow analysts — if you know why you need DOM and Volume Profile, it is a legitimate choice and the 30-day trial is a reasonable way to evaluate it. If you are not already a committed order flow trader, the setup complexity, Windows dependency, data-feed cost, and absence of built-in signals make Overcharts a poor fit for most retail traders.
Quantzee is built for the trader who wants the analysis to be actionable on arrival. The signal logic is on the chart, the risk levels are pre-calculated, and the non-repainting guarantee means the history you see matches what you would have seen live. Explore Quantzee’s indicators and see whether that style of chart reading fits.
Quantzee indicators are analytical software tools designed to assist your own analysis. This content is for educational purposes only and does not constitute investment advice. Do your own research. Trading involves risk of capital loss. Quantzee is not a registered investment advisor. Analytical software, not investment advice.
Frequently Asked Questions
Explore Quantzee Indicators
- SuperTrend Pro+ — dual-SuperTrend confluence with ATR TP/SL ladder
- AI Adaptive Quant Toolkit — all-in-one TradingView indicator with overlays and dashboard
- AI TrendPulse — clean trend detection on any chart
View all indicators · See pricing