Most indicators use one fixed setting for every market condition — the same RSI length in a dead range and a violent trend. That's why they whipsaw. An AI quant indicator takes a different approach: it detects which regime the market is in right now and adapts its calculations to match. The AI Adaptive Quant Toolkit is built around exactly this idea, and this guide explains how that adaptation actually works under the hood, so you can judge whether it fits how you trade.
This is an educational walkthrough of the methodology, not a buy or sell recommendation. The toolkit is analytical software, not investment advice — always do your own research.
What "adaptive" really means in a quant indicator
A standard indicator is static. You set a 14-period RSI or a 20-period Bollinger Band, and it applies that number whether the asset is grinding sideways or breaking out. Markets are not static, so static settings are wrong most of the time.
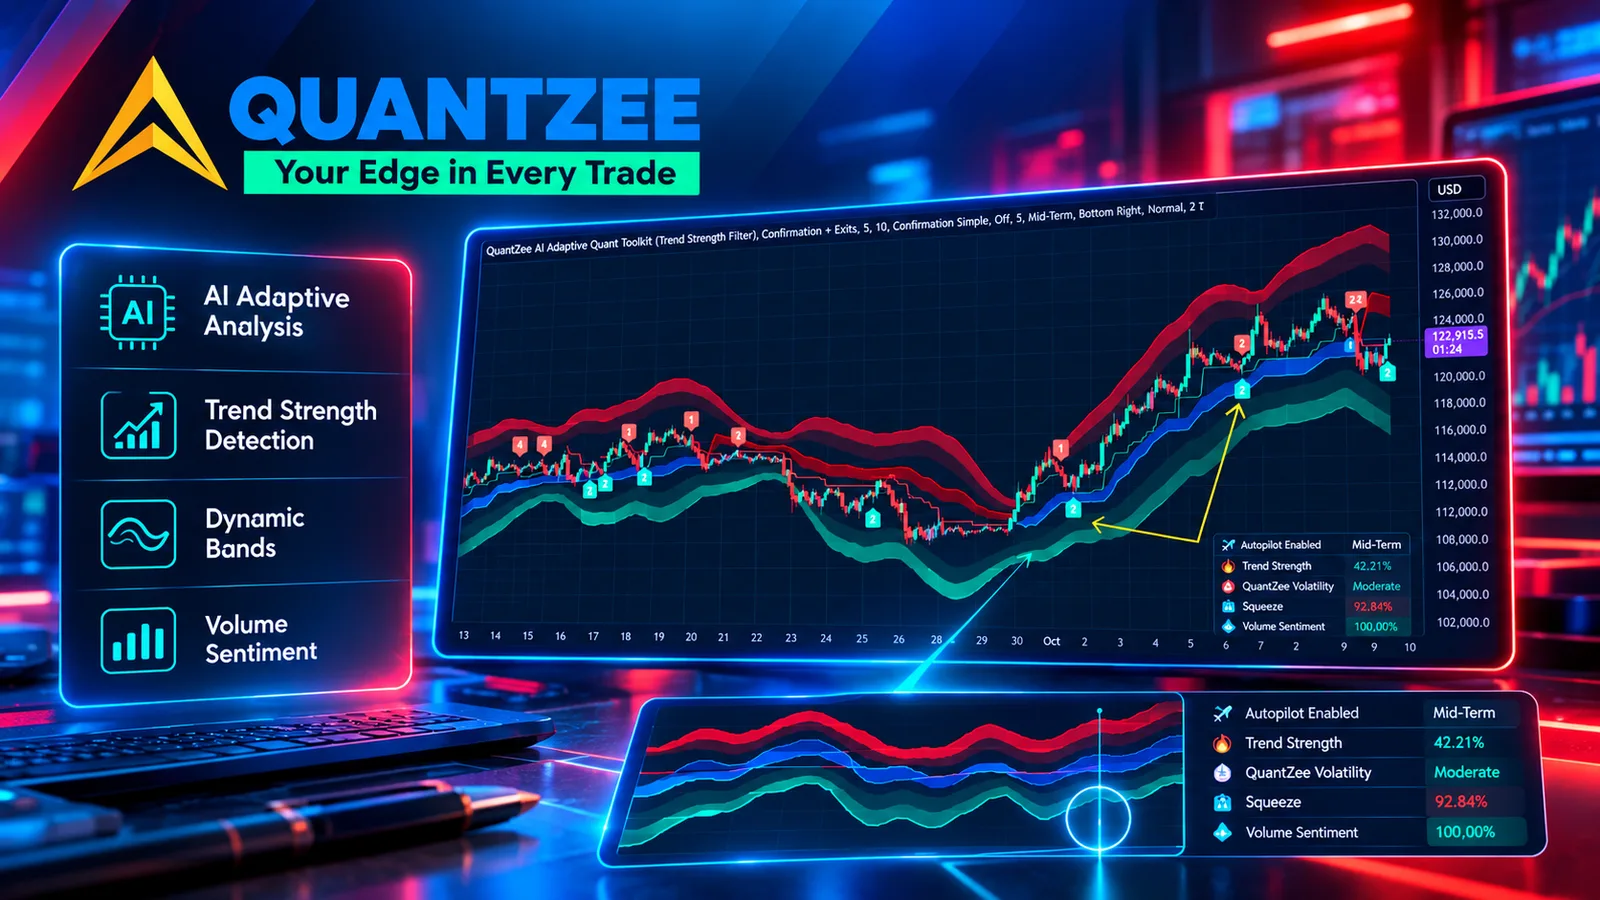
An adaptive quant indicator measures the current environment first, then adjusts. The AI Adaptive Quant Toolkit continuously reads several inputs — realised volatility, momentum slope, and statistical deviation from the mean — and shifts its sensitivity accordingly. In a low-volatility range it tightens to avoid false breakouts; in an expanding trend it loosens so it doesn't exit a good move three bars early. That single behaviour is the difference between an indicator that survives multiple market conditions and one that only works on the chart it was tuned to.
The building blocks behind the signals
Quant tools across the industry — from LuxAlgo's Quant engine to terminal-style scripts on TradingView — converge on a similar set of components, as outlined in LuxAlgo's own breakdown of quant-engine features. The AI Adaptive Quant Toolkit combines four:
1. Volatility and regime state
It calculates a Z-score to spot statistical overextensions (the zones where mean reversion becomes likely) and watches for volatility compression — the Bollinger-versus-Keltner "squeeze" that flags stored energy before an explosive move. This tells the toolkit whether to behave like a trend-follower or a mean-reverter.
2. Volume and participation
Relative volume separates genuine institutional participation (200%+ spikes) from retail noise. A breakout on flat volume is treated very differently from one backed by a surge — the same price move, two different conviction scores.
3. Market structure
The toolkit maps liquidity above and below price and distinguishes a real structural break from a liquidity sweep, where price hunts stops and then reverses. This is the SMC/ICT logic that price-action traders rely on, quantified instead of eyeballed.
4. A weighted verdict
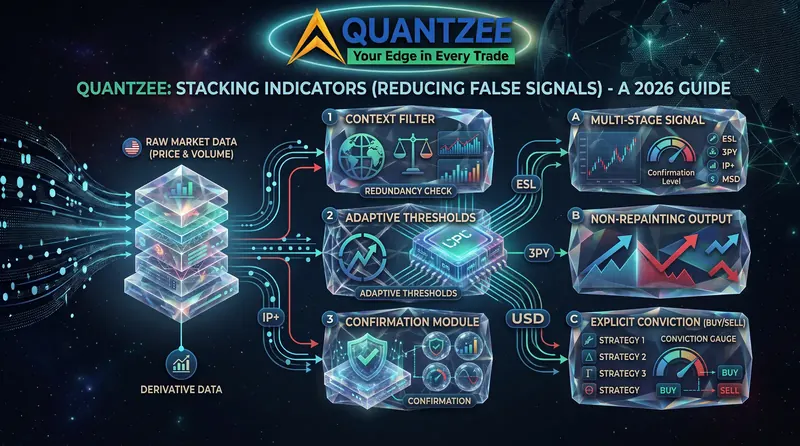
Rather than throwing ten disconnected lines on your chart, these signals feed a single scoring layer that outputs one clear read. The goal is to cut "analysis paralysis" — you get a synthesised view instead of conflicting indicators you have to mentally average.
Reading the weighted verdict in practice
Here's how the pieces combine on a real setup. Say price pushes into a prior high. On its own that's just a breakout. The toolkit checks: is relative volume above 200% (real participation) or flat (likely a trap)? Is the Z-score stretched into overextension, hinting at mean reversion? Did price sweep liquidity just below before pushing up, or is this a clean structural break? Each answer adjusts the score. A breakout on a 250% volume surge with structure intact and no overextension scores high; the same candle on thin volume into a stretched Z-score scores low — and you avoid a textbook fakeout. That synthesis, done in milliseconds every bar, is the work the toolkit removes from your plate.
Non-repainting: why it matters more than any feature
A repainting indicator changes its past signals after the fact, so a backtest looks brilliant while live performance collapses. Non-repainting signals lock once the bar closes — what you saw is what you got. The AI Adaptive Quant Toolkit is built to be non-repainting, which is the only honest basis for evaluating whether a tool actually works. When you compare any quant indicator, this is the first thing to verify, because it's the easiest place for vendors to flatter their results.
Who an adaptive quant indicator suits
This style of tool fits traders who want structure without writing code. You don't need a quant background to use it — the adaptation and scoring happen in the background. It works across stocks, crypto, forex, and indices because the underlying maths (volatility, volume, deviation) is market-agnostic rather than tuned to one instrument.
It's less suited to traders who want a single magic buy arrow with no context. The toolkit gives you a weighted read of conditions; you still apply your own risk rules, position sizing, and judgement. If you're weighing multiple TradingView indicator subscriptions, our subscription value breakdown is a useful companion read. You can see the full feature set and live signals on the AI Adaptive Quant Toolkit page.
How it fits alongside other tools
An adaptive quant indicator is not meant to be the only thing on your chart — it's the analytical layer that organises everything else. Traders typically pair it with a clean price chart and one confirmation tool they already trust, such as a higher-timeframe trend filter or a volume profile. The toolkit handles the heavy statistical work — Z-score deviation, squeeze detection, relative-volume reads — so the rest of your workflow gets simpler, not busier. If you trade multiple markets, the same logic carries over from a crypto chart to an index without re-tuning, which is where fixed-setting indicators usually fall apart.
Common mistakes when using a quant indicator
Three errors undermine even a good tool. First, treating the verdict as a standalone signal and skipping risk management — no score replaces a stop-loss and position sizing. Second, judging it on a single chart over a few days; you need to watch it across at least one range and one trend before forming an opinion. Third, ignoring the regime context — an overextension Z-score means very different things in a quiet market versus a trending one, and the whole point of an adaptive tool is that it tells you which you're in. Use the read, but keep your own decision rules in charge.
How to evaluate it before you commit
Treat any indicator like a hypothesis. Add it to a clean chart, watch it across at least two different regimes (a range and a trend), and check that the signals lock on bar close. For a broader look at why simulated results and live performance diverge in the first place, see our guide on why your backtest doesn't match live trading. Browse the full indicator lineup if you want to compare this approach against other tools on the platform. Compare its read against what later happened on 30–50 setups before you trust it with real risk. A good quant tool should make your decisions clearer and faster — if it just adds more noise, it isn't the right fit.
Frequently Asked Questions
What is an AI quant indicator?
It's an indicator that uses quantitative measures — volatility, volume, statistical deviation, and market structure — and adapts its settings to the current market regime instead of using one fixed value. The AI Adaptive Quant Toolkit combines these into a single weighted signal.
How is the AI Adaptive Quant Toolkit different from a normal RSI or moving average?
A normal RSI uses the same length in every condition. The toolkit detects whether the market is ranging or trending and adjusts its sensitivity, so it's tighter in quiet markets and looser in strong trends — reducing the whipsaws that fixed indicators produce.
Does the toolkit repaint?
No. It is built to be non-repainting, meaning signals lock once the bar closes and do not change retroactively. This is essential because repainting tools show inflated backtest results that don't hold up in live trading.
Which markets does it work on?
Because it's built on market-agnostic maths — volatility, relative volume, and statistical deviation — it works across stocks, crypto, forex, and indices rather than being tuned to a single instrument.
Do I need coding or quant knowledge to use it?
No. The regime detection, scoring, and adaptation run automatically. You read the synthesised signal and apply your own risk management — no Pine Script or statistics background required.
Is an AI quant indicator a guarantee of profit?
No. It is analytical software designed to clarify market conditions, not investment advice or a promise of returns. No indicator removes risk — you should backtest it, paper trade it, and do your own research before risking capital.
An adaptive quant indicator earns its place by staying useful across changing conditions instead of breaking the moment the market shifts. If you want to see how regime detection, non-repainting signals, and a weighted verdict come together in practice, explore the AI Adaptive Quant Toolkit and test it on your own charts. Remember: this is educational information only, not financial advice — trade your own plan and manage your risk.