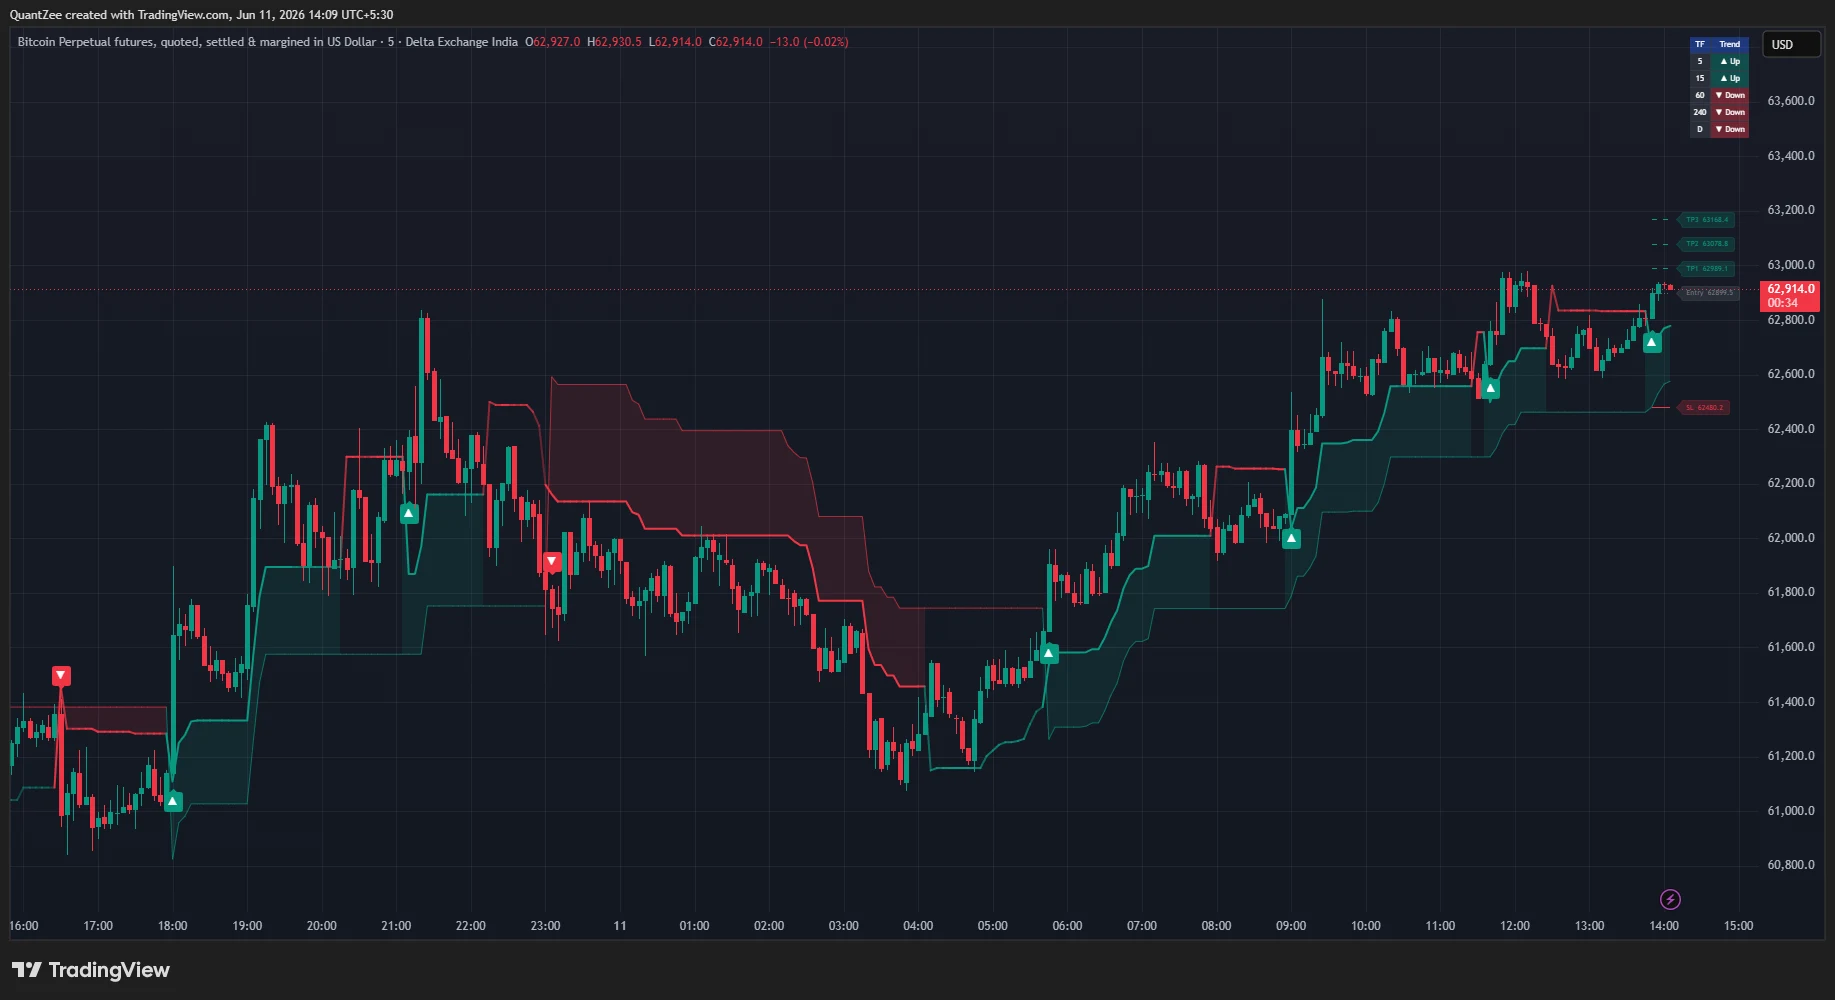
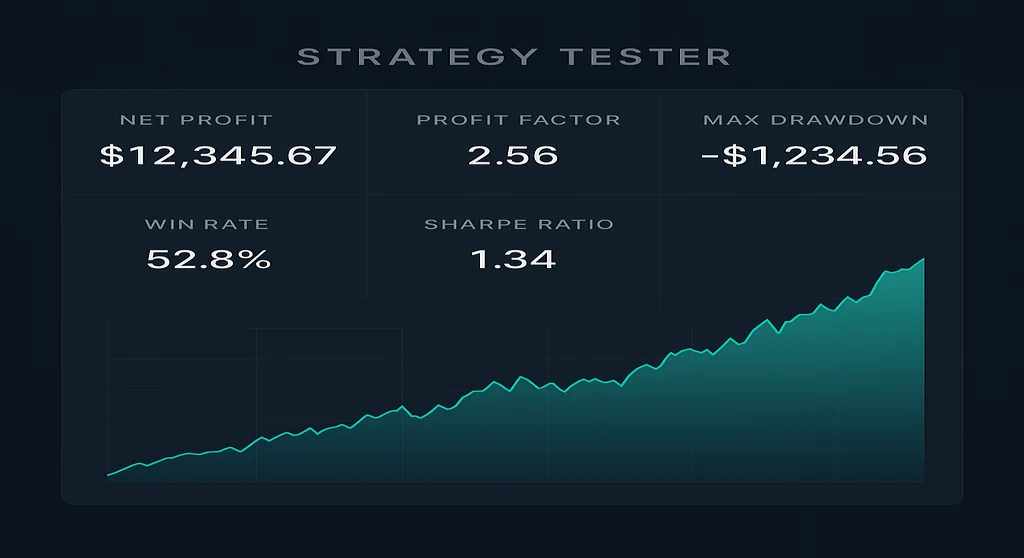
The short answer: To backtest a TradingView indicator, use Bar Replay (free, manual, any indicator) to step through historical bars and record your trades, OR convert the indicator logic to a Pine Script strategy and run it through TradingView’s Strategy Tester for automated performance metrics. The Strategy Tester gives you net profit, profit factor, Sharpe ratio, drawdown, and a full equity curve — but only works with strategies (not plain indicators), and is only as honest as the settings you use for commission, slippage, and look-ahead bias.
This guide covers both methods end to end, explains how to read every metric the Strategy Tester produces, and — critically — covers the ways backtests lie to you and how to avoid them.
Disclaimer: All content is for educational and informational purposes only. Quantzee indicators are analytical software tools, not financial advice. Backtested performance does not guarantee future results. Always apply your own risk management before committing real capital to any strategy.
Key Takeaways
- TradingView has two backtesting methods: Bar Replay (manual, free, any indicator) and the Strategy Tester (automated, requires a Pine Script strategy, more quantitative).
- The Strategy Tester is only as good as its settings — default zero-commission, zero-slippage results can be 30–50% too optimistic.
- Repainting indicators make backtests worthless. Always verify non-repainting behavior before you trust any backtest result.
- A real backtest uses at minimum 2–3 years of data, includes all transaction costs, and is validated on out-of-sample data the strategy has never seen.
- Profit Factor above 1.5 and Max Drawdown below 20% are the two most practical filters for retail traders.
What Is Backtesting and Why Does It Matter?
Backtesting is the process of applying a trading strategy or indicator’s rules to historical price data to see how it would have performed in the past. The core assumption is that if a strategy produces consistent results across a large, diverse sample of historical conditions, it has a reasonable chance of continuing to work going forward — because it is capturing a genuine market pattern rather than random noise.
The alternative to backtesting is forward-testing in real time (paper trading or live trading). Forward-testing is the more honest method — it shows real fills at real prices in conditions the strategy has never seen — but it requires weeks to months of patience before you have enough data to draw conclusions. Backtesting compresses that timeline by using historical data, letting you test across years of conditions in minutes.
The trade-off: backtesting is subject to a set of well-documented pitfalls that can make a losing strategy look profitable. Understanding these pitfalls is as important as understanding the mechanics of running the test.
For any indicator — whether it is TradingView’s built-in SuperTrend, a community script, or a premium suite like Quantzee’s SuperTrend Pro+ — backtesting is the minimum due diligence before trusting it in live trading.
The Two Backtesting Methods on TradingView
Method 1: Bar Replay (Free, Works With Any Indicator)
Bar Replay is TradingView’s built-in tool for manually stepping through historical price bars one at a time. It works with any indicator on any chart — you do not need a Pine Script strategy to use it.
When to use Bar Replay:
- You want to test an indicator you cannot modify (third-party or invite-only scripts)
- You are testing price-action or discretionary signals that require human judgment
- You want to verify whether an indicator repaints (signals that appear and then disappear on the next bar)
- You are learning and want to see signals form in real time without code
How to use Bar Replay (step by step):
- Open any TradingView chart with your indicator loaded.
- Click the clock icon (or press Shift+B) in the top toolbar to enter Bar Replay mode. The chart will show a red vertical line dividing past (left) from “unseen future” (right).
- Click anywhere on the chart to set the replay start point. The chart moves the red line to that point, hiding everything to the right.
- Use the right arrow key to step forward one bar at a time, or press Play to advance automatically at a set speed.
- As each bar forms, note whether your indicator fires a buy or sell signal, and record:
- Signal direction (buy/sell)
- Entry price (approximate — typically the close of the signal bar or open of the next bar)
- Exit price (when the indicator signals an exit, or when your rules say to exit)
- P&L of the trade
- After stepping through enough bars, tally your trades in a spreadsheet: total P&L, win rate, average win vs. average loss.
Advantages: Works with any indicator including invite-only scripts, requires no Pine Script knowledge, shows how signals form in real-time conditions.
Limitations: Slow (manually stepping through bars is time-consuming), result accuracy depends on your record-keeping discipline, no automated metrics.
Using Bar Replay to test for repainting: This is Bar Replay’s most critical use case. Step to a bar where a signal appears. Note the signal. Press the right arrow to advance one bar. Look back at the previous bar — if the signal that appeared is now gone or has moved to a different bar, the indicator repaints. A non-repainting indicator will show the same signal on the same bar regardless of how many subsequent bars you step through. For a step-by-step repainting test guide, see how to test any TradingView indicator for repainting.
Method 2: TradingView Strategy Tester (Automated, Requires Pine Script Strategy)
The Strategy Tester is TradingView’s built-in backtesting engine. It runs a complete simulation of a strategy’s historical performance and produces a full report with dozens of metrics — net profit, profit factor, Sharpe ratio, drawdown, win rate, and a full equity curve.
Critical distinction: The Strategy Tester only works with Pine Script strategies, not plain indicators. An indicator is a visualization tool (it paints signals on the chart). A strategy is code that actually places simulated orders based on those signals. Most indicators sold on TradingView are indicators, not strategies.
What this means for testing an indicator:
- If the indicator comes with a companion strategy script: add the strategy, open the Strategy Tester tab, and it runs automatically.
- If no companion strategy exists: you need to either write a Pine Script strategy that replicates the indicator’s signals, or test using Bar Replay (Method 1).
- Some vendors (like Quantzee) publish both indicator and companion strategy scripts in their suite.
How to access the Strategy Tester:
- Add a strategy (not an indicator) to your chart from the Indicators search. Strategies are marked with a small chart icon in the search results.
- The Strategy Tester panel automatically appears at the bottom of the chart.
- Click Overview, List of Trades, or Performance Summary tabs to see different views of the results.
- Click the gear icon next to the strategy name in the chart to open Strategy Properties — this is where you set initial capital, commission, slippage, and other critical settings.
Strategy Tester Properties: The Settings That Determine Result Honesty
The Strategy Tester Properties dialog controls the simulation assumptions. Default settings are deliberately simple — which is why default backtests are almost always misleading.
Initial Capital
The starting account size for the simulation. This affects position sizing (if you use a percentage-of-equity order type). For percentage-based sizing strategies, use a realistic starting capital that matches your actual trading account.
Order Size and Type
Three options:
- Contracts — a fixed number of units per trade (e.g., 1 BTC, 100 shares)
- Percentage of equity — a percentage of the simulated account per trade (most realistic for backtesting)
- USD amount — a fixed dollar amount per trade
For realistic backtesting, use Percentage of equity with a value that reflects your actual risk per trade (commonly 1–5% depending on your risk appetite).
Commission
This is the setting most beginners leave at zero — and it is the biggest source of inflated backtest results.
Set commission to match real-world costs:
- Crypto exchanges: 0.04–0.10% per trade (0.08% round-trip typical)
- US equities retail brokers: $0 commission, but consider SEC fees (~$0.01 per share)
- Forex: spread equivalent (often 0.5–2 pips depending on pair and broker)
- Indian equities/futures (NSE): brokerage + STT + exchange fees: roughly 0.02–0.05% per trade depending on product and broker
Independent backtesting research consistently shows that adding realistic commission reduces apparent profitability by 20–40% on high-frequency strategies. A strategy that produces 8% monthly profit before costs may produce 3–4% after realistic commission rates are applied.
Slippage
Slippage is the difference between the price at which the strategy places a simulated order and the price at which it would actually fill in the real market. Default is zero — which is unrealistic for any strategy that does not trade with limit orders at a liquid, tightly-spread market.
Practical slippage settings:
- Liquid large-cap stocks (AAPL, MSFT): 1 tick slippage
- Crypto majors (BTC/USDT on Binance): 1–2 ticks
- Lower-cap crypto, less liquid pairs: 3–5 ticks
- NIFTY/BankNIFTY futures: 1–2 ticks during market hours; wider during open/close
For strategies that place large orders relative to average volume, slippage can be substantially higher. If your strategy cannot survive 2–3 ticks of slippage without becoming unprofitable, it is not viable for live trading.
Pyramiding
Controls how many open positions the strategy can hold simultaneously in the same direction. Default is 1 (no pyramiding). Set to match your actual trading rules.
Recalculate
Two options: Every tick (real-time recalculation as each price tick arrives) or Once per bar close (recalculates only when a bar closes). For most non-scalping strategies, Once per bar close is the realistic setting — it simulates how the strategy would operate in real time, where you act on confirmed closed-bar signals. “Every tick” can introduce look-ahead bias in some strategy constructions.
Reading the Strategy Tester Performance Report
The Performance Summary tab provides the complete quantitative picture. Here is what each metric means and what thresholds actually matter.
Net Profit
Total simulated profit (after commission and slippage) over the test period. Expressed both as a dollar amount and as a percentage of initial capital.
How to interpret it: Net profit in isolation is meaningless. A 200% return sounds impressive — but not if it came with a 70% drawdown, meaning you would have had to endure losing 70% of your account before seeing that gain. Net profit must always be read alongside max drawdown.
Profit Factor
Gross winning trades divided by gross losing trades. If the strategy made $10,000 on winning trades and lost $6,000 on losing trades, profit factor = 10,000 / 6,000 = 1.67.
Thresholds:
- Below 1.0: Strategy loses money overall. Do not trade it.
- 1.0–1.3: Marginal. Will likely not survive real trading costs and execution variation.
- 1.3–1.5: Acceptable for very high-frequency strategies. Borderline for lower-frequency.
- 1.5–2.0: Good. A realistic edge for a well-designed strategy.
- Above 2.0: Strong. But scrutinize for overfitting — real strategies rarely sustain profit factors above 2.5 across diverse conditions.
Max Drawdown
The largest peak-to-trough decline in the simulated equity curve — the maximum paper loss the strategy experienced from any equity peak before recovering. Expressed as both a percentage and dollar amount.
Thresholds:
- Below 10%: Conservative. Compatible with most retail risk tolerances.
- 10–20%: Acceptable for well-diversified or moderate-risk strategies.
- 20–30%: High. Most retail traders will exit the strategy during the drawdown, which negates the backtested return.
- Above 30%: Very high. Unlikely to be tradeable by a real human account who experiences the drawdown in real time.
Investopedia’s max drawdown definition notes that maximum drawdown understates psychological difficulty — the strategy owner experiences the drawdown as it happens, one day at a time, and the pressure to abandon the strategy is highest precisely at the drawdown’s lowest point.
Sharpe Ratio
Return divided by volatility of returns, measuring risk-adjusted performance. A higher Sharpe ratio means more return per unit of risk.
Thresholds (annualized):
- Below 0.5: Poor risk-adjusted return. Not worth pursuing.
- 0.5–1.0: Acceptable. Many real-world strategies fall here.
- 1.0–2.0: Good. Institutional grade at the high end.
- Above 2.0: Exceptional — or overfit. Backtested Sharpe ratios above 2.0 frequently drop to 1.0–1.5 in live trading.
Investopedia’s Sharpe Ratio explainer covers the calculation in detail. Note that TradingView’s Sharpe calculation uses bar returns, not daily returns — which produces different numbers than traditional annualized Sharpe calculations.
Percent Profitable (Win Rate)
The percentage of trades that were profitable. Often the most-watched metric by beginners — and the most overweighted.
A strategy with a 40% win rate that makes 3× on winners and loses 1× on losers (R-multiple of 3) will be significantly more profitable than a strategy with a 70% win rate that makes 0.5× on winners and loses 1× on losers (R-multiple of 0.5). Win rate only matters in the context of average win vs. average loss.
Average Win / Average Loss
The average profit on winning trades divided by the average loss on losing trades. This is your R-multiple. A strategy needs a positive expectancy: (Win Rate × Avg Win) − (Loss Rate × Avg Loss) > 0.
Example: Win rate = 50%, Avg Win = $150, Avg Loss = $100. Expectancy = (0.50 × 150) − (0.50 × 100) = 75 − 50 = +$25 per trade.
Number of Trades
The sample size of the backtest. This is critically important and chronically underweighted.
Minimum credible sample sizes:
- Below 30 trades: Results are statistically meaningless. Too small to distinguish skill from luck.
- 30–100 trades: Preliminary. Directionally informative but insufficient for confidence.
- 100–300 trades: The minimum for a meaningful evaluation.
- 300+ trades: Statistically robust, assuming diverse market conditions are represented.
A strategy that shows a 70% win rate on 20 trades has demonstrated nothing. The same 70% win rate on 300 trades across diverse conditions is much more credible.
Equity Curve
The visual plot of cumulative P&L over the test period. Look for:
- Smooth, steady upward slope: Signal of consistent performance across market conditions.
- Long flat periods: Strategy does not perform in certain market conditions — probably ranging markets if it is a trend-following system.
- Sharp vertical drops: Major losing events, possibly correlated with high-volatility news events.
- Downward slope at the end: The strategy may have been overfit to the earlier data and is decaying.
The Biggest Backtesting Mistakes (And How to Avoid Them)
1. Repainting Indicators Make All Backtests Fictional
This deserves to be listed first because it renders everything else irrelevant. An indicator that repaints is one whose signals change on historical bars after new data arrives. A strategy built on a repainting indicator produces backtested results that were never achievable in real time — the signals on the chart represent information that was not available when those bars formed.
The result is a seemingly incredible win rate and equity curve that will perform randomly or negatively in live trading.
Verify before you backtest: Use Bar Replay to confirm the indicator’s signals do not change as you step forward through bars. Only proceed to Strategy Tester testing after confirming non-repainting behavior. See our complete guide on non-repainting TradingView indicators for the test methodology.
Quantzee indicators (SuperTrend Pro+, AI Adaptive Quant Toolkit, SuperTrend Fusion, and all others in the suite) are built on a signal-locking architecture: all signals evaluate on bar close and never change. This is verifiable in Bar Replay and documented in their Pine Script construction.
2. Look-Ahead Bias in Strategy Execution
Look-ahead bias occurs when the strategy uses information that would not have been available at the moment the trade would have been placed.
The most common Pine Script version: a signal fires on the daily close at price X. The strategy code sets strategy.entry() at price X. In reality, you would see the close-of-day signal AFTER the bar closes — you could only enter at the NEXT bar’s open, typically at a slightly different price.
The fix in Pine Script:
// BAD — enters at signal bar close (look-ahead bias)
if buySignal
    strategy.entry("Long", strategy.long)

// CORRECT — enters at next bar's open
if buySignal[1]  // [1] means check the previous (confirmed) bar's signal
    strategy.entry("Long", strategy.long)
Look-ahead bias systematically overstates backtested performance because the simulated fills occur at more favorable prices than real-time execution would produce.
3. Overfitting (Curve Fitting)
Overfitting is the most pervasive and subtle backtesting problem. It occurs when you optimize your strategy’s parameters — ATR period, RSI threshold, multiplier factor — until the historical backtest looks excellent. You are not discovering a genuine market pattern; you are fitting random noise in the historical data.
An overfit strategy will typically:
- Have a very large number of parameters relative to the number of trades tested
- Show perfect or near-perfect performance during the optimization period
- Perform poorly on any data it has not been optimized against
How to detect overfitting:
- Keep the number of free parameters small relative to your trade sample. A strategy with 10 adjustable parameters should have at least 300 trades before any optimization is credible.
- Use walk-forward testing (see below).
- Apply the strategy unchanged to a new asset or time period it was not optimized on. If performance degrades sharply, the original results were overfit.
4. Insufficient Data and Single-Market Condition Testing
A strategy that shows strong results on 6 months of historical data has been tested across at most one or two distinct market conditions. Markets cycle through trending, ranging, high-volatility, and low-volatility periods. A trend-following strategy that was tested exclusively on a strong uptrend will show artificially high results.
Minimum data requirements:
- Intraday strategies (1m–1H): At minimum 6 months of bars. Prefer 12–18 months.
- Daily strategies: At minimum 3 years. Prefer 5+ years including at least one major bear market.
- Weekly strategies: At minimum 10 years.
TradingView’s free plan limits visible historical data depth on some instruments and timeframes. Premium plans (Plus, Pro, Premium) provide access to deeper historical data. TradingView’s Deep Backtesting feature (available on higher-tier plans) extends Strategy Tester results across the full available instrument history.
5. Testing Only One Asset or Market
A strategy that performs well on BTC/USDT may fail completely on ETH/USDT, EUR/USD, or NIFTY. Testing on one asset introduces survivorship selection bias — you may have selected this asset specifically because it trended during your test period.
Best practice: after developing a strategy on one asset (your “training” asset), test it unchanged on at least two or three similar assets or timeframes. If the edge is real, it should transfer to similar instruments without material parameter changes.
6. Zero Commission and Slippage (Default Settings)
Covered in the Strategy Tester properties section above — but worth restating as a mistake because it is so common. Default Strategy Tester settings use zero commission and zero slippage. No real brokerage offers this. A strategy that is profitable at zero commission may not survive real trading costs.
Always input your actual expected commission and at least 1–2 ticks of slippage before drawing any conclusion from a Strategy Tester result.
7. Survivorship Bias
If you are testing a strategy on “today’s best-performing stocks,” you are testing on a selection of stocks that survived and performed well — which is known in advance to be a favorable population. The stocks that went bankrupt, delisted, or performed poorly during your test period are not in your dataset.
Survivorship bias inflates expected returns by 1–3% annually in academic research estimates. For TradingView backtesting: test across indices (which are reconstituted and therefore have some survivorship bias) but be aware of it, or test on instruments where the universe is defined at the start (e.g., the S&P 500 constituents as of the test start date, not today’s constituents).
In-Sample vs. Out-of-Sample Testing
The most rigorous backtesting methodology splits your historical data into two distinct pools that are never mixed.
In-sample (training) data: The period used for development and optimization. You build the strategy rules, optimize parameters, and evaluate initial performance here.
Out-of-sample (test) data: A separate period, kept strictly isolated from the in-sample period, that the strategy has never been optimized on. Results on out-of-sample data are the honest performance estimate.
A typical split: use the first 70% of available data as in-sample (e.g., 2018–2023 for a strategy using 2018–2026 data) and reserve the final 30% (2023–2026) as out-of-sample for validation.
The warning sign: If in-sample performance is substantially better than out-of-sample performance, the strategy is overfit. The degree of decay is the degree of overfitting.
In TradingView, you implement this by setting your strategy’s date range filters in the Properties to cover only the in-sample period, optimizing there, then manually changing the date range to the out-of-sample period and running the strategy without any parameter changes.
Walk-Forward Testing: The Highest Standard
Walk-forward testing is a more rigorous extension of in-sample/out-of-sample testing that better simulates real-world deployment.
The process:
- Optimization window: Optimize the strategy on the most recent N periods (e.g., 6 months).
- Forward test window: Apply the optimized parameters to the next M periods (e.g., 3 months) without changes. Record results.
- Roll forward: Move both windows forward by M periods. Repeat optimization and testing.
- Aggregate results: Combine all forward-test windows into a composite out-of-sample performance estimate.
Walk-forward testing answers the practical question: “If I had been re-optimizing this strategy periodically throughout history, what would the live results have looked like?” It is more realistic than a static in-sample/out-of-sample split because it accounts for the need to adapt parameters over time.
TradingView does not have a native walk-forward testing tool — implementing it requires manual window adjustment or external tools. For systematic traders who want to test walk-forward rigorously, this typically means exporting the indicator signals and running the walk-forward analysis in Python or another quantitative tool.
Statistical Significance: Is Your Backtest Sample Telling the Truth?
A backtest with 20 trades showing a 70% win rate is not statistically meaningful — by chance alone, you could flip a coin and get 70% heads in a 20-flip test. The result does not tell you that your strategy has a genuine edge.
A rough guide to minimum trades needed for statistical confidence at the 95% significance level, depending on your observed win rate:
| Win Rate | Min Trades for 95% Significance |
|---|---|
| 50% (break-even) | 384+ |
| 55% | 289+ |
| 60% | 178+ |
| 65% | 112+ |
| 70% | 68+ |
These numbers assume independent trades. In practice, trades in trending markets are correlated — a winning streak in a strong trend is less statistically significant than the same number of randomly distributed winning trades. Treat these minimums as lower bounds, not sufficient conditions.
How to Backtest TradingView Indicators by Market
Backtesting in Stocks/Equities
For US equity strategies, the most common pitfall is testing exclusively on a period of strong market appreciation (2019–2021, for example). A trend-following strategy on US equities will look extraordinary over any period that contained a sustained multi-year bull market. Test across periods that include the 2020 COVID crash, the 2022 rate-hike selloff, and ideally data from the 2008–2009 financial crisis if the instrument’s history goes back that far.
Also check: does your strategy’s performance differ significantly between sector ETFs? A momentum strategy may work well in technology sectors and poorly in utilities — sector-specific performance patterns can suggest the edge is narrower than the overall equity market test implies.
Backtesting Crypto Indicators on TradingView
Crypto presents unique backtesting challenges:
- Extreme volatility regimes. The 2021 bull market, the 2022 bear market, and the subsequent 2023–2024 recovery represent three completely different volatility regimes. A strategy must be tested across all three to have meaningful results.
- 24/7 trading. Overnight and weekend sessions exist in crypto but not in equities. A strategy tested on equities that ignores this will miss gaps that matter for crypto.
- Exchange-specific behavior. Crypto backtests on TradingView use exchange price feeds that may differ slightly from the exchange you intend to trade. Binance spot BTC/USDT will have different tick behavior than Bybit BTC/USDT perpetuals.
The AI Adaptive Quant Toolkit’s Autopilot engine — which self-optimizes its parameters in real time based on current volatility — addresses the regime-shift problem partly at the indicator level. But this does not eliminate the need for robust backtesting across multiple crypto market regimes.
Backtesting Forex Indicators on TradingView
Forex backtesting has a major data quality concern: TradingView’s forex feed (Oanda by default) may not exactly match the execution environment of your actual broker. Spread can vary significantly between providers, particularly during news events and rollover periods.
Practical approach:
- Test on major pairs (EUR/USD, GBP/USD) during liquid sessions only.
- Add realistic spread as commission in the Strategy Tester (typically 0.5–2 pips on EUR/USD depending on broker).
- Avoid testing strategies on the 1-minute chart for Forex — the historical data at that resolution is often lower quality.
- Investopedia’s overview of forex market structure covers the decentralized nature of forex pricing that makes perfectly reproducible backtesting impossible.
Backtesting NIFTY and Indian Index Indicators
For NIFTY and BankNIFTY traders on TradingView, backtesting has both a regulatory and a practical dimension.
Regulatory: SEBI’s guidelines on algorithmic trading require that algorithms used for live trading be approved and disclosed. Backtesting for personal research and development purposes is separate from algo deployment. Always consult the current SEBI framework before automating any strategy for live trading on Indian exchanges.
Practical considerations:
- NIFTY’s intraday behavior is heavily session-bound: the 9:15–10:15 AM IST open is the highest-volatility period. Test separately on opening-hour vs. rest-of-session data.
- TradingView’s NSE data feed (from the National Stock Exchange of India) is reliable for intraday and daily NIFTY/BankNIFTY backtesting.
- Indian equity derivatives have expiry-day dynamics (every Thursday for weekly NIFTY) that can produce anomalous results in backtests that do not account for expiry rollovers.
SuperTrend Pro+‘s dual-confluence system reduces false signals during the volatile NIFTY open precisely because the slow SuperTrend acts as a stability filter — which tends to benefit performance statistics in backtesting by eliminating the opening-session whipsaws that inflate the loss count in naive single-SuperTrend tests.
TradingView Free Plan vs. Paid Plans for Backtesting
| Feature | Free Plan | Basic (Free reg) | Plus/Pro | Premium |
|---|---|---|---|---|
| Strategy Tester | Yes | Yes | Yes | Yes |
| Historical data depth | Limited | Limited | More | Most |
| Deep Backtesting | No | No | Yes (Pro+) | Yes |
| Bar Replay | Yes | Yes | Yes | Yes |
| Indicators on chart | 3 | 3 | 5 / 10 | 25 |
| Saved strategies | Limited | Limited | More | Most |
| Intraday data depth | Limited (bars) | Limited | Extended | Full |
For most retail backtesting purposes, TradingView’s free plan is sufficient for initial testing. The primary limitations are:
- Historical data depth — free plans may not provide 3–5 years of intraday data for backtesting, which is a material constraint for intraday strategies.
- Deep Backtesting — a Premium/Pro+ feature that extends Strategy Tester history to the full available data, up to potentially decades for some instruments.
If you are backtesting daily or weekly strategies, the free plan typically has adequate data depth. For intraday backtesting (1-minute, 5-minute) where you need multiple years of data, a paid plan may be necessary.
Step-by-Step: Complete Backtesting Workflow for a TradingView Indicator
Here is the full methodology from zero to a trustworthy result.
Step 1 — Choose and Test Your Indicator for Repainting
Before any backtesting: use Bar Replay to verify the indicator does not repaint. Step through at least 20–30 signals and confirm each signal that appeared on a bar stays on that bar after subsequent bars form.
If the indicator repaints: stop here. The backtest result will be fiction. Find a non-repainting alternative.
Step 2 — Define Your Trading Rules Explicitly
Before running any backtest, write out your complete rule set:
- Entry trigger: exactly what signal fires the entry (e.g., “SuperTrend Pro+ dual-confluence long signal fires on the 5-minute bar close”)
- Entry price: next bar open, or signal bar close? (Next bar open is more realistic)
- Stop-loss: fixed (e.g., below slow SuperTrend line) or ATR-based?
- Take-profit: target (e.g., 2× ATR from entry) or trailing?
- Position size: fixed or percentage of equity?
- Filters: any conditions that must be met before entry (e.g., only trade signals where higher-timeframe trend agrees)?
- Session filters: only trade during certain hours?
If you cannot write out these rules precisely, you do not yet have a testable strategy. The Strategy Tester requires fully explicit rules — discretion cannot be backtested.
Step 3 — Configure Strategy Tester Settings Correctly
In Strategy Properties:
- Initial capital: your realistic account size
- Order size: percentage of equity (e.g., 10% per trade) that matches your risk per trade
- Commission: your realistic expected transaction cost per side
- Slippage: at least 1–2 ticks
- Recalculate: Once per bar close
- Close entries at bar close: Off (usually)
Step 4 — Run the Initial Backtest (In-Sample Period Only)
Set date range to your in-sample period (e.g., your strategy was developed on 2022–2024 data: set from 2022-01-01 to 2024-01-01).
Review: Does the strategy have at least 100 trades? If fewer, extend the test period or switch to a more active timeframe — the sample is too small.
Step 5 — Read the Performance Report
Check in this order:
- Trade count: Sufficient? (100+ minimum)
- Net profit: Positive? (Necessary condition, not sufficient)
- Profit factor: Above 1.5?
- Max drawdown: Below 20%?
- Sharpe ratio: Above 0.75?
- Equity curve: Smooth and consistent, or choppy with long flat periods?
If any of these fail: do not proceed. Revise the strategy rules or reject the indicator.
Step 6 — Validate on Out-of-Sample Data
Change the date range to your out-of-sample period (e.g., 2024–2026), making zero changes to the strategy parameters. Re-run.
Compare in-sample vs. out-of-sample on all metrics. If out-of-sample profit factor drops from 2.0 to 0.9, the strategy is overfit — the in-sample results are not predictive of future performance.
A realistic expectation: out-of-sample results will be somewhat worse than in-sample (markets change, some optimization-period patterns do not persist). A 10–20% degradation in profit factor is normal. A 50%+ degradation suggests material overfitting.
Step 7 — Test on Additional Assets
Without any parameter changes, run the strategy on two or three similar assets: if you developed it on NIFTY 5-minute, test on BankNIFTY 5-minute and perhaps a liquid midcap index. If you developed it on EUR/USD daily, test on GBP/USD daily and AUD/USD daily.
If the strategy has a genuine edge, it should transfer reasonably across similar markets. If it only works on the exact asset it was developed on, the result is almost certainly specific to that asset’s price history during that period.
Step 8 — Forward Test (Paper Trade) Before Going Live
After all the above, the final validation is forward testing: paper trade the strategy in real time for a minimum of 4 weeks (or until you have at least 30 forward-test trades). Use the same rules, the same entry prices, the same stops — the only difference is no real capital is at risk.
If forward-test results are in line with the backtested expectation (not necessarily identical, but in the same general zone), the strategy has passed its real-world validation. Only then should live capital be committed.
Checklist: Is Your Backtest Trustworthy?
| Check | Passes? |
|---|---|
| Indicator verified non-repainting via Bar Replay | Yes / No |
| Strategy uses next-bar-open execution (not signal-bar-close) | Yes / No |
| Commission set to realistic level (not zero) | Yes / No |
| Slippage set to at least 1–2 ticks (not zero) | Yes / No |
| Test period spans at least 2–3 years with mixed conditions | Yes / No |
| Trade count: 100+ trades | Yes / No |
| Profit Factor above 1.5 | Yes / No |
| Max Drawdown below 20% | Yes / No |
| Out-of-sample result within 20–30% of in-sample | Yes / No |
| Tested on at least one additional asset without parameter changes | Yes / No |
| Forward-tested for minimum 4 weeks | Yes / No |
If any item in this checklist fails, the backtest result should not be used to commit real capital.
How Quantzee Indicators Are Designed for Honest Backtesting
One reason to prefer premium indicators built for professional use: the non-repainting guarantee is the foundation that makes backtesting meaningful.
SuperTrend Pro+ uses confirmed-bar-close signal evaluation and lookahead=false on all multi-timeframe data, meaning the signals you see in a Bar Replay test are exactly the signals that would have appeared in real time. The ATR trade-level ladder (TP1/TP2/TP3/SL) draws only on confirmed bar closes. This is what makes a SuperTrend Pro+ backtest honest: you are testing the real historical signal, not a retroactively constructed one.
The AI Adaptive Quant Toolkit’s Autopilot engine is worth a specific note in the backtesting context: the parameter selection that the engine performs in real time is based only on historical bar data at the moment of the current bar’s close. It does not look forward to optimize parameters using future data. This makes the Toolkit’s Autopilot output backtest-stable — the parameters shown on historical bars are the parameters that would have been selected at those bars in real time.
For traders who want to backtest Quantzee indicators using the Strategy Tester, companion strategy scripts are available as part of the suite. These scripts replicate the indicator signals with next-bar-open execution and configurable commission/slippage for Strategy Tester integration.
Start with quantzee.com/pricing/ — all 13 indicators plus companion strategy scripts, $9.99/month with a 14-day money-back guarantee.
Frequently Asked Questions
Conclusion: Backtesting as Discipline, Not a Permission Slip
Backtesting is not a way to prove a strategy will work — it is a way to check that a strategy is not obviously broken. A strategy that passes rigorous backtesting criteria has earned the right to forward testing. A strategy that fails those criteria should be revised or abandoned regardless of how compelling it looks on the chart.
The discipline of honest backtesting is what separates systematic trading from hope-based trading. The process described in this guide — non-repainting verification, realistic commission and slippage, adequate sample size, out-of-sample validation — is the difference between a backtest that informs a real decision and one that tells you what you want to hear.
For traders using Quantzee indicators: SuperTrend Pro+, SuperTrend Fusion, and the AI Adaptive Quant Toolkit are built with non-repainting architecture as a core design constraint. You can run the Bar Replay test described in this guide on any of them and see the same signals on historical bars that appeared in real time. That non-repainting foundation is the minimum requirement for your backtest to mean anything.
All 13 Quantzee indicators are available at $9.99/month with a 14-day money-back guarantee.
Related Reading
- Non-Repainting TradingView Indicators: The Complete Guide
- How to Test Any TradingView Indicator for Repainting in 5 Minutes
- Best Buy Sell Indicator for TradingView 2026
- Best TradingView Indicators 2026: Ranked and Reviewed
- SuperTrend Fusion Indicator Guide
- How to Choose a TradingView Signal Tool
Authority References
- TradingView Strategy Tester Documentation — Official TradingView guide to the Strategy Tester report.
- TradingView Pine Script — Repainting Documentation — How repainting occurs and how to avoid it in Pine Script.
- Investopedia: Backtesting — Core concepts, methodology, and limitations of backtesting.
- Investopedia: Maximum Drawdown — Definition and interpretation of max drawdown in strategy evaluation.
- Investopedia: Sharpe Ratio — Risk-adjusted return calculation and interpretation.
- Investopedia: Profit Factor — Definition and benchmarks for profit factor in strategy evaluation.
- NSE India: NIFTY Trading Specifications — Official NIFTY 50 and BankNIFTY contract specifications.
- SEBI: Algorithmic Trading Framework — India’s regulatory framework governing automated and algorithmic trading.
Educational Disclaimer: All content in this article is for informational and educational purposes only. Quantzee indicators are analytical software tools for chart analysis — not financial advice, investment recommendations, or guarantees of any trading result. Backtested performance does not predict future market outcomes. Always conduct your own research, consider the regulatory requirements for algorithmic trading in your jurisdiction, and apply your own risk management rules before committing capital to any strategy.