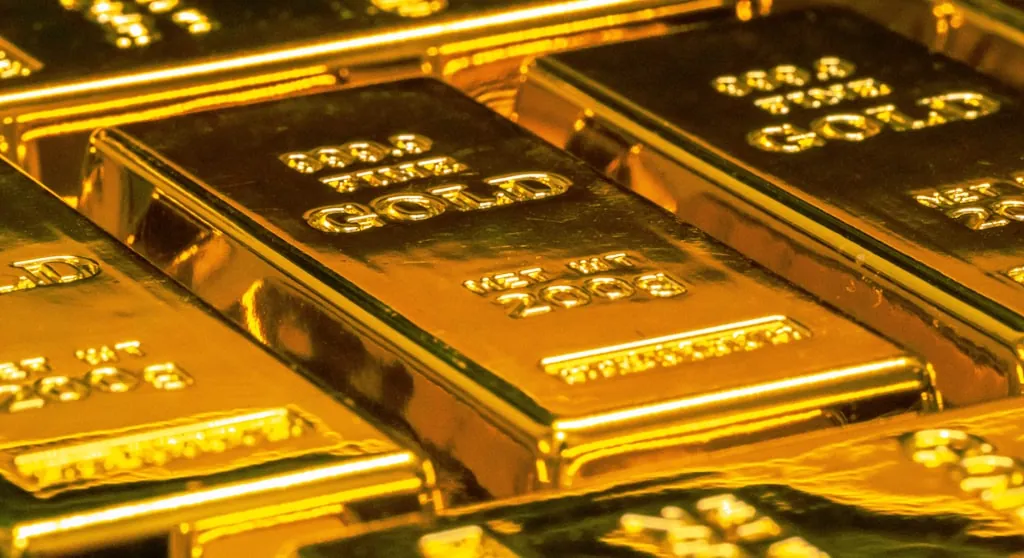
If you were watching the precious metals space on TradingView during May and June 2026 — particularly if you had AI TrendPulse or SuperTrend Pro+ loaded on your gold and silver charts — you had a front-row seat to one of the cleaner macro-driven commodity setups in recent memory. Gold broke out to new all-time highs, silver played its usual game of “almost but not quite,” and the macro backdrop driving both metals was exactly the kind of sustained, structural shift that regime-aware indicators are designed to detect. Here’s a breakdown of what actually drove this move, where the key chart signals appeared, and what the divergence between the two metals is really telling traders who are paying attention.
⚡ Key Takeaways
- Gold's May–June 2026 rally to the $3,300–$3,500/oz range was driven by fiscal credibility concerns (weak Treasury auction demand), sustained DXY weakness, and relentless EM central bank buying — a structural move, not speculative mania.
- Silver underperformed gold because ~50–55% of its demand is industrial — uncertainty around China's property sector and global growth weighed on silver's industrial component even as its monetary case strengthened alongside gold.
- A gold/silver ratio of 85–95 historically signals silver is undervalued relative to gold; ratio compression beginning in late June 2026 — triggered by record Chinese solar installation data — marked the start of a silver catchup rotation.
- AI TrendPulse is designed to detect regime shifts from consolidation to directional trend — precisely the pattern that appeared in early May as fiscal concerns catalysed gold's breakout; SuperTrend Pro+'s dual-SuperTrend confluence confirmed silver's late-June rotation. Both use non-repainting, closed-bar signal logic.
- The structural bull case for metals remains intact through H2 2026: de-dollarisation, EM central bank buying, energy-transition silver demand, and sovereign debt trajectories — key watch points include Fed rate cut timing, DXY levels, and China industrial data.
The Setup: What Was Already In Place Heading Into May
Coming into May 2026, gold had spent most of Q1 consolidating after its explosive 2024–2025 run that pushed prices past $3,000/oz for the first time in history. The market was in a classic “wait and see” posture — watching the Fed, watching the dollar, and watching geopolitical noise out of the Middle East and Eastern Europe.
A few structural tailwinds were firmly in place:
Central bank buying remained relentless. The trend that started accelerating post-2022 (after Russia’s reserves were frozen) never really stopped. Emerging market central banks — China, the region, Poland, Turkey, and several Gulf states — continued adding gold to their reserves on any meaningful dip. This is not speculative flow. It’s a structural, multi-year reallocation out of dollar reserves, and it creates a persistent floor under gold that didn’t exist 10 years ago.
Real yields were still uncomfortably elevated relative to historical norms, but the market’s forward expectation had shifted. The consensus coming into May was that the Fed was done hiking and would begin cutting sometime in H2 2026 — meaning gold’s biggest headwind (positive real rates) was priced to weaken going forward.
The dollar had been grinding lower since early 2026, and the DXY was hovering around the low-to-mid 99 range — not catastrophically weak, but directionally unfavorable for metals-denominating currencies globally.
Understanding these macro dynamics is also why having the right trading indicators and market analysis tools matters — macro-driven commodity moves require a framework, not just a chart pattern.
What Actually Happened in May
May brought a confluence of catalysts that compressed what might have been a slow grind into a sharp, fast move.
The debt ceiling / fiscal credibility narrative came back with force. The US fiscal deficit trajectory — which was already alarming on a structural basis — got renewed attention after a weak 20-year Treasury auction in early May. When the bond market sneezes on fiscal credibility, gold historically catches the cold in the best possible way. Long-duration buyers stepped away, yields on the long end moved uncomfortably, and the “debasement hedge” bid in gold came back fast.
On top of that, escalating trade tensions in Asia — and a notable shift in rhetoric from several BRICS economies around settlement currencies — reminded the market that de-dollarization, while slow, is not going away. Gold is the obvious beneficiary of any world where the dollar’s role in global trade diminishes, even marginally.
Gold made new all-time highs (or retested them, depending on your chart) somewhere in the $3,300–$3,500 range during this window. Volume was solid. Momentum indicators were stretched but not absurdly so — this wasn’t a blow-off top, it was an institutional-grade trend continuation.
For traders running AI TrendPulse on a daily gold (XAUUSD) chart, early May would have been a regime-change moment. AI TrendPulse’s adaptive logic detects when the trend environment shifts from range-bound or consolidating to directional — and the fiscal credibility shock combined with the DXY slide is exactly the kind of macro catalyst that registers as a regime transition. A bullish regime signal in early May, with gold pushing above recent consolidation and momentum aligning, would have kept a TradingView trader positioned on the right side of the $3,300–$3,500 advance rather than waiting for confirmation at higher prices. The key word here is “could have”: this is what the regime-change framework is designed to catch — not the news catalyst itself, but the moment the chart structure confirms the shift.
Silver’s Frustrating Divergence — and Why It Actually Makes Sense
Here’s where it gets interesting, and where a lot of newer investors get confused.
Silver underperformed gold meaningfully through most of May and into early June. The gold/silver ratio — which measures how many ounces of silver it takes to buy one ounce of gold — remained elevated, in the 85–95 range, rather than compressing toward the 60–70 range that would signal silver “catching up.”
Why? Three reasons:
1. Industrial demand uncertainty. Silver is ~50–55% an industrial metal (solar panels, EVs, electronics, medical devices). When global growth expectations are shaky — and the 2026 environment has had plenty of growth scares, particularly around China’s property sector continuing to drag — the industrial component of silver gets marked down even as its monetary component would argue for a higher price. Gold doesn’t have this problem. Gold is purely a monetary/store-of-value asset.
2. Retail speculative positioning. Silver is the retail trader’s metal. It’s accessible, it’s volatile, and it attracts a crowd that trades momentum. After the big 2024–2025 run, a lot of that positioning was already in. You need new money to push silver explosively higher, and new retail money in 2026 had more options competing for attention (crypto, AI stocks, etc.) than it did in 2020.
3. ETF flows lagged. SLV and other silver ETFs didn’t see the same proportional inflows that GLD did. Institutional money that was adding gold exposure wasn’t proportionally adding silver — which tells you this rally was primarily a macro/monetary hedge trade, not a broad risk-asset commodities move.
June: The Catchup Trade Starts
By mid-to-late June, the narrative started to shift for silver. Here’s what changed:
The solar industry demand numbers out of China for Q1 2026 were genuinely staggering. China’s installed solar capacity additions continue to break records every quarter, and silver is a key input in photovoltaic cells. When analysts updated their full-year silver demand forecasts in light of these numbers, the market woke up to the supply/demand picture: above-ground silver inventories are not abundant, primary silver mine supply has been essentially flat for years, and if monetary demand even partially catches gold’s move, the math gets compelling fast.
The gold/silver ratio started compressing — moving from the mid-90s toward the mid-80s in the back half of June. That’s the early signal of silver outperformance beginning.
The “poor man’s gold” narrative resurfaced in retail communities, bringing fresh buying into physical silver and silver ETFs alike.
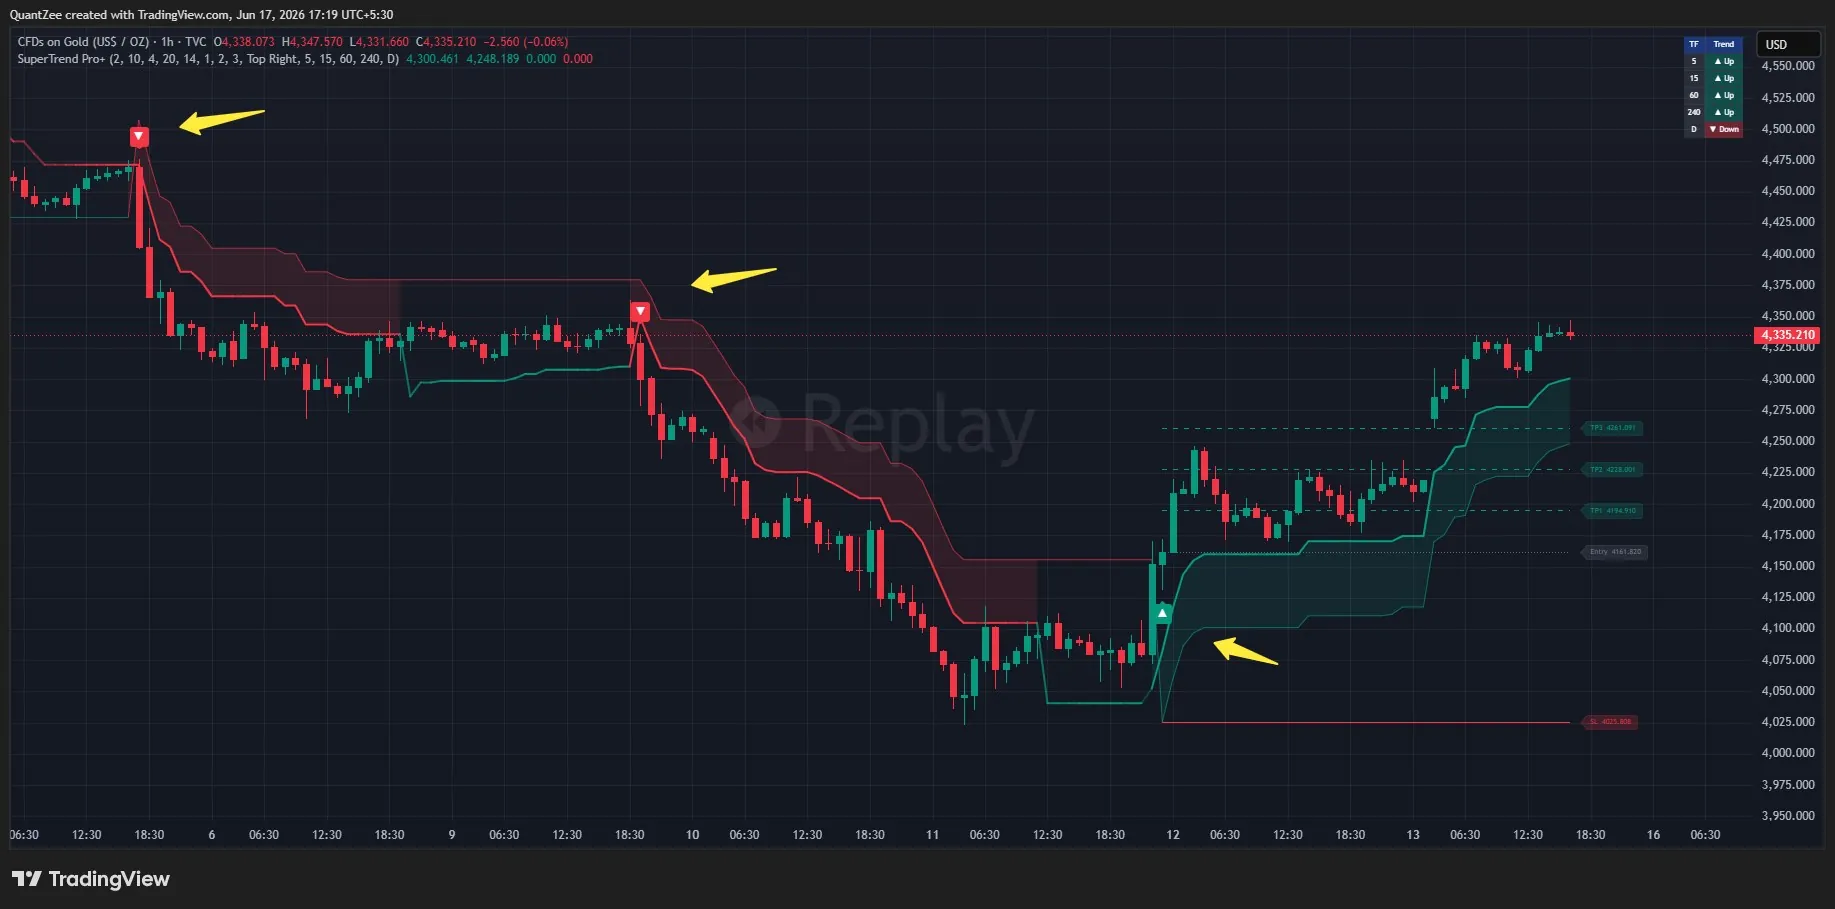
Traders watching silver (XAGUSD) on TradingView with SuperTrend Pro+ would have started seeing early trend-flip signals as the gold/silver ratio began compressing in late June. SuperTrend Pro+ requires two SuperTrend calculations to agree before firing a signal — when silver started clearing overhead resistance and both lines flipped bullish on the daily and 4H timeframes, it offered an early read on the catchup rotation that the solar demand data had catalyzed. The signal is not about predicting the news; it is about recognizing when price structure and trend momentum have shifted decisively enough to confirm a position.
What the Divergence Is Actually Telling You
The gold/silver ratio is one of the most watched macro signals in the commodities world, and it’s worth taking seriously rather than treating it as a Reddit meme.
A very high ratio (90+) historically suggests one of two things: either gold is overbought and will pull back, or silver is undervalued relative to gold and will eventually catch up. The correct interpretation depends on why the ratio is elevated.
Right now, the elevated ratio is primarily explained by silver’s industrial demand uncertainty dragging it down, not by gold being irrationally bid. That’s an important distinction. It suggests the mean reversion — when it comes — will happen via silver moving up, not gold moving down.
If the global industrial cycle re-accelerates (driven by infrastructure spending, the energy transition, or restocking in Asia), silver’s industrial demand profile becomes an accelerant rather than a headwind. That’s the setup a lot of people in this community are watching for.
For traders looking to trade these commodity moves with precision — especially breakouts in Gold or Silver — the AI TrendPulse indicator on TradingView detects regime changes and trend continuation signals adaptively. The May 2026 gold move was a textbook bullish regime transition: consolidation to directional trend, catalyzed by a macro shock. That is precisely the pattern AI TrendPulse’s regime-change logic is designed to catch — not on the daily close of the top, but at the point where the trend environment durably shifts.
What to Watch Going Into H2 2026
A few things will determine whether this metals rally has legs or needs to consolidate:
The Fed’s actual rate cut path. Every Fed meeting matters. Cuts = weaker dollar and lower real yields = tailwind for both metals. Delays or hawkish surprises = near-term headwind.
The dollar trajectory. DXY below 98 is broadly supportive. A reversal back toward 103–104 would create near-term pain even if the long-term thesis remains intact.
China’s industrial demand. Watch monthly solar installation data, EV production numbers, and any meaningful stimulus out of Beijing. Each of these directly affects silver’s industrial demand profile.
Central bank buying continuation. If EM central banks slow their gold accumulation, the structural floor weakens. So far there’s no sign of this, but it’s worth monitoring.
The geopolitical backdrop. Wars, sanctions, and dollar weaponization remain bullish for gold on a structural basis. Any de-escalation on multiple fronts could remove some of the fear bid.
If you’re tracking multiple markets simultaneously — metals, forex (DXY), rates, and indices — a multi-market TradingView indicator suite that works across asset classes can help you track all these signals without jumping between screens. Traders using an AI trading indicator can set alerts directly on TradingView to catch these momentum shifts as they develop.
Bottom Line
Gold’s move from May to June 2026 was driven by a classic combination of fiscal credibility concerns, dollar weakness, ongoing central bank buying, and forward rate cut expectations. It was orderly, institutional, and grounded in macro — not speculative mania.
For TradingView traders running indicator-based frameworks, this kind of macro-driven trend is where tools like AI TrendPulse and SuperTrend Pro+ are designed to add analytical value: not by predicting the news, but by detecting when price structure and market regime have shifted decisively enough to stay in a trade. The regime-change logic that AI TrendPulse uses is built to flag these transitions early; the dual-SuperTrend confluence output from SuperTrend Pro+ is built to confirm continuation and spot catchup rotations — as silver’s late-June move illustrated. Both indicators use non-repainting, closed-bar signal logic, which matters in commodity markets where live-bar signals can produce false positives on volatile intraday swings.
Silver’s lag was a feature, not a bug — the industrial demand uncertainty weighed on it even as its monetary profile argued for higher prices. The compression of the gold/silver ratio in June suggests that rotation is beginning, but silver outperformance at scale likely needs an industrial demand catalyst to fully materialize.
Both metals remain in structural uptrends driven by forces that won’t reverse quickly: de-dollarization, central bank reserve diversification, the energy transition’s demand for silver, and sovereign debt trajectories that favor hard assets.
If you’ve been in since early 2024, you’ve had a good run. If you’re looking at this for the first time, the thesis isn’t over — but you’re not getting in at the beginning anymore, and chasing ATHs without a clear framework for your own entry and exit is how people get hurt.
Do your own research. This is not financial advice.
FAQ: Gold Silver Rally 2026 — Your Questions Answered
What caused gold to hit all-time highs in May–June 2026?
The May–June 2026 gold rally was driven by a combination of fiscal credibility concerns (weak US Treasury auction), dollar weakness (DXY in the low-to-mid 99 range), relentless central bank buying from EM economies, and the market pricing in Fed rate cuts for H2 2026. These tailwinds compressed into a fast move that pushed gold into the $3,300–$3,500/oz range.
Why did silver underperform gold during the May 2026 rally?
Silver underperformed because it carries dual identity: ~50–55% industrial metal, ~45–50% monetary metal. When global growth expectations are uncertain (especially due to China’s property sector drag), the industrial component gets marked down. Additionally, retail speculative positioning was already elevated after the 2024–2025 run, and ETF inflows into SLV lagged GLD significantly — signaling institutional buying was a macro hedge, not a broad commodities trade.
What is the gold/silver ratio and what does the current level mean?
The gold/silver ratio measures how many ounces of silver are needed to buy one ounce of gold. A high ratio (85–95+) historically suggests silver is cheap relative to gold. In the May–June 2026 context, the elevated ratio reflects silver’s industrial demand uncertainty, not gold being overbought. When the ratio begins compressing (as it started doing in June), it signals silver is beginning to catch up — the mean reversion is via silver up, not gold down.
Is the gold rally over or does it have more upside in H2 2026?
The structural case remains intact: de-dollarization, EM central bank buying, sovereign debt trajectories, and the energy transition (silver demand) are multi-year forces. Whether the rally continues near-term depends on: the Fed’s actual rate cut path, DXY staying below 98, China industrial demand, and the geopolitical backdrop. A DXY reversal back toward 103–104 would create near-term headwinds even if the long-term thesis holds.
How can traders use AI TrendPulse and SuperTrend Pro+ to track gold and silver on TradingView?
Macro-driven commodity moves — like the gold/silver 2026 rally — are best tracked with adaptive, regime-aware indicators rather than static formula-based tools. AI TrendPulse is designed to detect regime shifts — the moment when a consolidating market transitions into a directional trend, which is exactly what gold did in early May 2026. SuperTrend Pro+ provides dual-SuperTrend confluence signals, useful for confirming trend continuation and spotting early catchup rotations like silver’s move in late June. Both indicators use non-repainting, closed-bar signal logic — critical in commodity markets where live-bar signals can produce false positives on volatile intraday swings. This is analytical software designed to support your own research and analysis; it is not investment advice.
This article is for informational and educational purposes only. Nothing here constitutes financial advice. Always do your own research before making any investment or trading decisions.