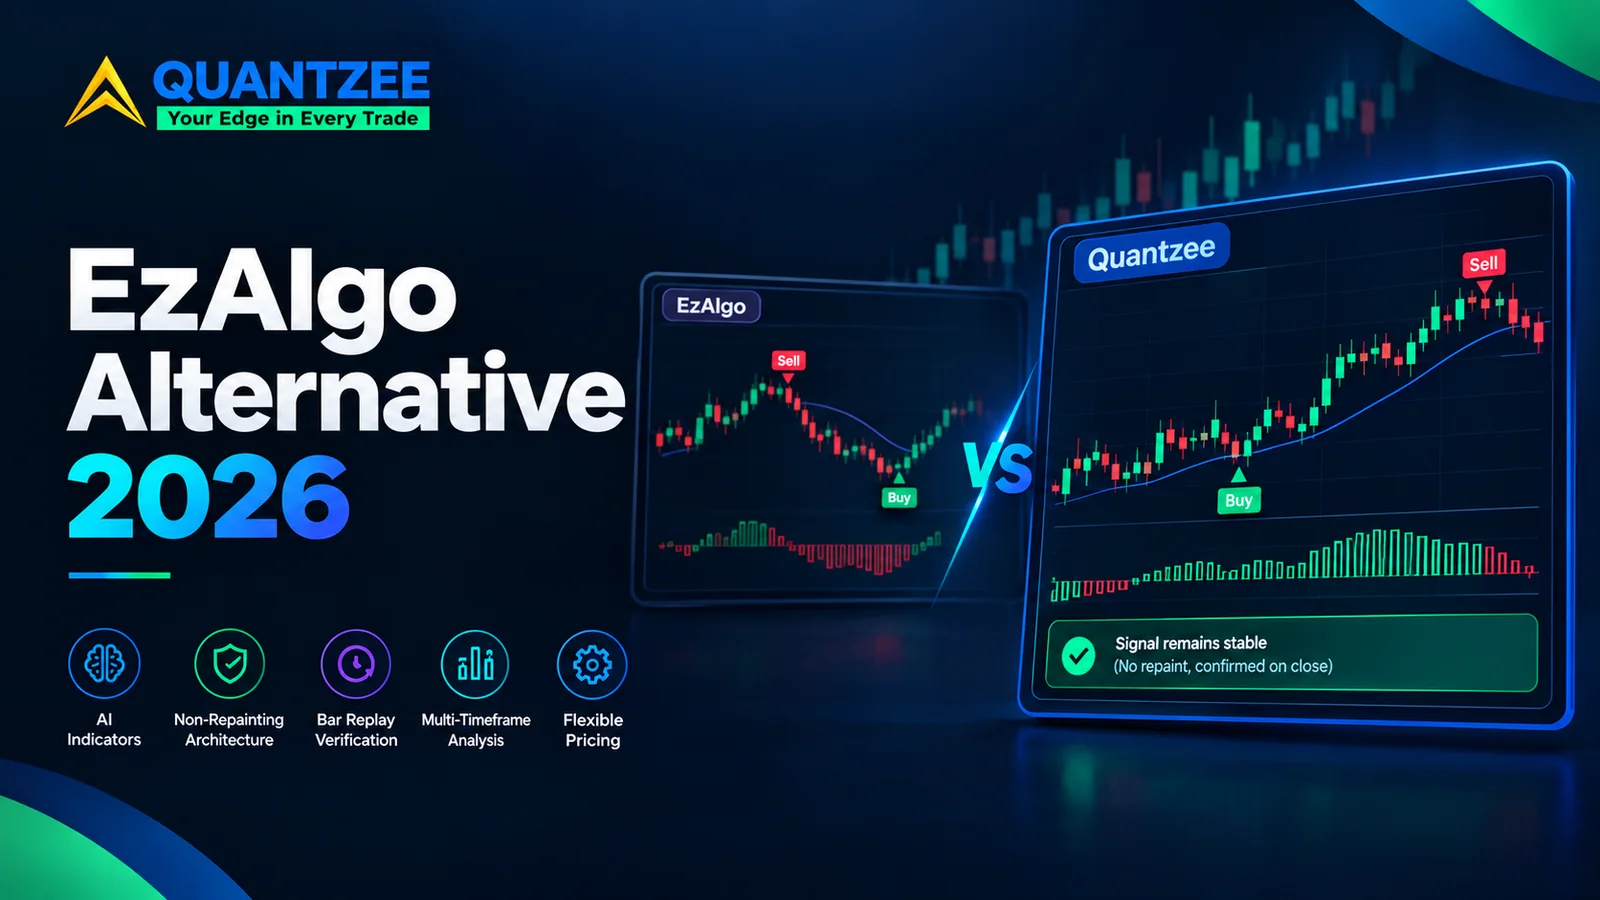
EzAlgo markets itself as a modern AI-powered indicator suite for TradingView — advanced algorithms, real-time analytics, multi-timeframe support. On paper, it ticks a lot of boxes. But for traders who have tested enough indicator tools to know the difference between genuine machine learning signals and rebranded overlays with an AI label attached, the details matter. This breakdown cuts through the positioning to look at what EzAlgo actually delivers, where it falls short, and why a growing number of traders are switching to Quantzee — an AI trading indicator suite — for a more reliable, more affordable, and genuinely non-repainting analytical experience.
The single most important question you should ask about any TradingView indicator is simple: does it repaint? If signals on past bars shift or vanish as new data arrives, every backtest and every historical chart you admire is built on fiction. This article is the definitive guide to understanding indicator repainting — what it is, why it happens mechanically in Pine Script, how to test any indicator for it yourself, and why EzAlgo’s ambiguity on this question is the main reason traders are looking for alternatives.
⚡ Key Takeaways
- EzAlgo costs $75/month via EzTrades, or $49 one-time for lifetime access. Quantzee is $59.99 once — so against the EzAlgo lifetime option the prices are close, and the question becomes what you actually get: Quantzee publishes its non-repainting architecture, lets you verify it on Bar Replay before you pay, and emails you the Pine Script source for all six indicators.
- EzAlgo has not published a technical non-repainting guarantee; Quantzee's signals are computed on confirmed, closed bars and are verifiable via TradingView's Bar Replay at zero cost.
- The Quantzee suite's published non-repainting architecture is independently testable before you buy — and readable in the source afterwards.
- A repainting indicator inflates backtested win rates by producing signals in hindsight that were never visible in real time — any tool with unverified non-repainting behavior produces historical performance statistics you cannot trust in live trading.
Top 4 Alternatives to EzAlgo in 2026 (Quick Comparison)
If you’re comparing EzAlgo against the field rather than just against one competitor, here’s where it sits relative to the other tools traders in this category most often shortlist:
| Rank | Tool | Category | Starting Price | Notable Limitation / Fit |
|---|---|---|---|---|
| 🏆 1 | Quantzee | AI signal indicators (TradingView) | $59.99 once — Pine source emailed, no renewal | Non-repainting, verifiable on Bar Replay, covers crypto, stocks, forex & commodities |
| 2 | EzAlgo | — | $75/mo ($49 lifetime) | no published repaint documentation |
| 3 | LuxAlgo | Related tool in this category | See full comparison | Different feature/price tradeoff — worth shortlisting alongside EzAlgo |
| 4 | Quantum Algo | Related tool in this category | See full comparison | Different feature/price tradeoff — worth shortlisting alongside EzAlgo |
Quantzee tops this list on price-to-signal-clarity ratio — $59.99 paid once against EzAlgo’s $75/mo ($49 lifetime), with non-repainting logic you can verify yourself before paying. For the side-by-side view across every tool in this category, see the full Quantzee comparison page. The detailed, feature-by-feature comparison against EzAlgo specifically follows below.
Table of Contents
- Top 4 Alternatives to EzAlgo in 2026 (Quick Comparison)
- What is EzAlgo?
- Why Traders Are Looking for EzAlgo Alternatives in 2026
- What Is Indicator Repainting? A Technical Explanation
- The Bar Replay Test: How to Verify Any Indicator for Repainting
- EzAlgo and the Repainting Question
- EzAlgo Pros and Cons
- EzAlgo Pricing (2026)
- What Users Say About EzAlgo
- Meet Quantzee: A Better EzAlgo Alternative
- What People Are Saying About Quantzee
- EzAlgo vs Quantzee: Feature Comparison
- Who Should Use Which?
- Conclusion
- FAQs
What is EzAlgo?
EzAlgo (ezalgo.ai) is a TradingView-based indicator suite that positions itself around AI-generated signals and advanced algorithmic analysis. The platform targets active traders who want automated signal detection without building their own strategies from scratch, offering a blend of trend-following tools, momentum signals, and multi-timeframe analysis overlays. You can see their public presence at EzAlgo on TradingView.
EzAlgo appears regularly in comparisons of LuxAlgo alternatives and premium TradingView indicator suites, which indicates it has built real awareness in the active trading community. Its core pitch is accessibility — the idea that sophisticated algorithmic trading signal generation should not require a quant background to use effectively.
The platform supports forex, crypto, and equities trading through TradingView’s charting environment. EzAlgo’s interface emphasises clean signal presentation, and the marketing materials highlight real-time analytics as a core differentiator. For traders who have grown frustrated with purely visual indicator libraries, EzAlgo’s focus on signal clarity is a step in the right direction — provided those signals hold up under scrutiny.
Why Traders Are Looking for EzAlgo Alternatives in 2026
The central issue that drives traders away from EzAlgo — and from many similarly positioned indicator tools — is signal integrity. Specifically: does the indicator repaint?
In the world of TradingView indicators, this is not a minor technical footnote. A repainting indicator is one where signals plotted on past bars shift or disappear as new data arrives, creating the illusion of excellent historical accuracy that simply does not exist in live trading conditions. If you backtest a repainting indicator, the results will look compelling. If you trade it live, you will chase signals that were never real and miss entries that the chart “shows” you in hindsight.
The repainting problem is endemic to the premium indicator market, and it is the primary reason experienced traders have become deeply sceptical of AI-branded tools. Every vendor claims clean, reliable signals. Very few are willing to publish the technical architecture that would let you verify that claim independently. When a vendor stays silent on this point, the silence itself is informative.
EzAlgo, like many AI-branded indicator suites, has received mixed community feedback on signal reliability in live conditions. Users in forums and review threads have raised questions about whether the signals they see in hindsight match what was available at the time — a classic sign of repainting logic. EzAlgo has not published a clear, technical non-repainting guarantee with implementation details, and that ambiguity is itself the reason traders seek alternatives. You cannot make a serious trading decision based on a historical chart whose signals you cannot independently verify were present in real time.
Beyond signal integrity, pricing is a recurring friction point. EzAlgo’s positioning as a premium AI product is reflected in its pricing, which sits meaningfully above budget-tier alternatives. For traders in emerging markets — the region, Southeast Asia, Latin America — where trading capital is proportionally smaller, a high monthly subscription is a real barrier, especially when the signal quality cannot be independently verified before purchase.
Finally, EzAlgo’s market coverage is weighted towards forex and crypto, with limited optimisation for global market instruments. Traders working with the index, or your exchange stocks often find that tools calibrated to Western equity and forex microstructure do not translate cleanly to the index derivatives context.
What Is Indicator Repainting? A Technical Explanation
Repainting is the single most misunderstood concept in TradingView indicator evaluation, and it deserves a precise technical explanation — because once you understand exactly how it happens in Pine Script, you will never evaluate an indicator the same way again.
Why Indicators Repaint: The Root Causes
1. Lookahead enabled in higher-timeframe data calls
Pine Script’s request.security() function lets an indicator fetch data from a higher timeframe. There is a parameter called lookahead which, when set to barmerge.lookahead_on, causes the function to fetch the next higher-timeframe bar’s data before that bar has actually closed. This means on a 15-minute chart, a signal might be drawn using daily OHLC values that won’t be finalised until the end of the current trading day. The signal looks confirmed. The data it used won’t be confirmed for hours. When the day closes differently from the current mid-day snapshot, the signal shifts.
2. Evaluating signals on live, unconfirmed bars
Every bar on TradingView has two states: forming (the bar is in progress) and closed (the bar is complete and its OHLC values are immutable). An indicator that evaluates its logic on the forming bar will flicker constantly. A signal may appear at 9:15 AM because the bar’s current high crossed a threshold — and then disappear at 9:16 AM because price retraced. By 9:30 AM when the bar closes, the final signal state might be completely different from what you observed at 9:15. In hindsight, the chart only shows the final state of each closed bar, so the signal history looks clean even though you experienced a very different reality in real time.
3. Referencing the live bar’s forming high or low
Some indicator logic specifically uses high or low values on the current bar to define breakout signals, pivots, or dynamic levels. These values change tick by tick while the bar is forming. An indicator that fires a buy signal when high exceeds a threshold will appear to trigger precisely at that level in hindsight — because high is locked once the bar closes. But in real time, that high was moving, and the signal may have appeared, disappeared, and reappeared multiple times before the bar closed.
4. Negative-offset future references
Pine Script allows indexing with negative numbers to reference future bars relative to the current position. Code like high[-1] references the high of the next bar. This kind of forward reference is an obvious form of lookahead and produces signals that are entirely fictional during live trading, even though they appear precise on a historical chart.
The common thread across all four causes: the historical chart only shows you the settled state of each completed bar. Repainting logic exploits this by using information that was not available when the bar was forming. What you see on the chart in replay looks like a perfect signal — but it was never available to you at that moment in real time.
How Quantzee Guarantees Non-Repainting: The Architecture
Quantzee’s non-repainting guarantee is not a marketing claim — it is a consequence of specific, verifiable implementation decisions:
Confirmed bar evaluation only. Every Quantzee indicator evaluates its signal logic exclusively on confirmed, closed bars. In Pine Script terms, this is enforced by gating signal computation on barstate.isconfirmed. A signal is written to a bar only after that bar’s OHLC values are permanently locked and will never change. Once a bar closes, the signal is immutable.
Higher-timeframe calls with lookahead off and one-bar offset. Any request.security() call in a Quantzee indicator uses lookahead_off and references the previous completed higher-timeframe bar, not the current forming one. This eliminates the category of repainting caused by mid-bar HTF data.
No future references. Quantzee’s Pine Script code contains no negative-index future references. All signal logic references only historical data that was genuinely available when the bar formed.
The result of these three practices is a simple, verifiable property: once a Quantzee indicator draws a signal on a bar, that signal does not move, does not disappear, and does not change as subsequent bars form. The chart you see after the fact is identical to what you would have seen in real time. This is the only definition of non-repainting that matters for a working trading tool.
The Bar Replay Test: How to Verify Any Indicator for Repainting
You do not have to take any vendor’s word for this. TradingView’s Bar Replay feature lets you independently verify whether any indicator is non-repainting. Here is the exact protocol — you can run this yourself on any indicator, including Quantzee.
Step 1: Add the indicator to a chart
Open any chart on TradingView and add the indicator you want to test. Let the chart load fully and note where the signals appear on the recent historical bars.
Step 2: Enable Bar Replay mode
Look for the clock icon in TradingView’s top toolbar. Click it to enter Bar Replay mode. Set the replay start point to a date that falls within the historical range where you already noted the signals — but choose a point before those signals, so you can watch them form in real time during the replay.
Step 3: Step through bars one by one
Use the step-forward button to advance the chart one bar at a time. As each bar closes, note exactly where signals appear and on which bars they are drawn. Take a screenshot or write down the precise bars where signals appear as of each step.
Step 4: Let the replay run to completion
Advance the replay through to the present date, or at least well past the range where you noted signals in Step 1. Do not stop the replay partway — some repainting only becomes visible as more bars are added.
Step 5: Compare the replay results to the original chart
Now exit Bar Replay mode and look at the same chart with the same indicator applied in normal (non-replay) mode. Compare: are the signals in the same positions as you observed them appearing during the replay? Are there signals on the finished chart that were not there during the replay? Have signals from the replay disappeared on the finished chart?
Interpreting the results:
- If signals appeared during replay at bars X, Y, and Z, and those same bars X, Y, and Z show signals on the finished chart — and no new signals appeared, and none disappeared — the indicator is non-repainting.
- If signals were present during replay and are now gone, or if signals now appear on bars that showed nothing during replay, the indicator repaints.
When you run the Bar Replay test on a Quantzee indicator, you will observe that the signals from Step 3 are identical to the signals on the completed chart in Step 5. This is not coincidence — it is a direct consequence of the confirmed-bar-only architecture described above. Every signal that appears during live trading is the same signal that will appear on that bar for the rest of time.
This test is free, reproducible, and requires no technical knowledge. If any indicator vendor claims non-repainting but discourages you from running this test, that is a warning sign.
EzAlgo and the Repainting Question
EzAlgo does not publish a technical architecture statement explaining how its signals handle confirmed versus unconfirmed bars, whether request.security() calls use lookahead_on or lookahead_off, or how the indicator behaves during Bar Replay testing. For many traders, this absence of disclosure is itself the answer.
The trading community’s feedback on EzAlgo’s signal integrity in live conditions has been mixed. Threads on Reddit’s r/TradingView and similar forums contain accounts from users who noticed that the signals they saw on EzAlgo’s historical charts did not correspond to what the indicator was showing during live trading sessions. This pattern is consistent with some form of lookahead or unconfirmed-bar evaluation — the hallmarks of a repainting indicator.
To be fair: absence of disclosure does not prove repainting. It is possible that EzAlgo’s implementation is sound but simply undocumented. But from a risk management standpoint, “undocumented” and “repainting” carry the same practical cost to a trader. If you cannot verify the claim independently, you cannot build a trading system on it.
What ambiguity costs you as a trader
Consider what happens when you make trading decisions based on an indicator whose non-repainting status you cannot verify:
Your backtesting results are unreliable. If even a portion of the historical signals are artifacts of lookahead, your win rate, expected value, and risk/reward ratios are all inflated. You are optimising for a reality that never existed.
Your confidence calibration is wrong. Traders build conviction in a system by watching it perform over time. If the signals that appear in live trading are different from those shown in hindsight, your pattern recognition is being trained on false data. You are learning to recognise setups that do not actually precede the outcomes you think they do.
Your live performance diverges from your backtested expectations. This is the practical outcome every repainting victim experiences: the indicator looked great on paper, live trading was inexplicably worse. The divergence is not bad luck — it is a direct consequence of the lookahead in the historical signals.
The Bar Replay test described above eliminates all of this ambiguity. It costs you ten minutes. Run it on any indicator you are evaluating before committing to a subscription.
Disclaimer: Quantzee indicators are analytical software tools designed to assist your own analysis. This content is for educational and informational purposes only and does not constitute investment advice. Do your own research before trading. Trading involves risk of capital loss. Quantzee is not a registered investment advisor. Treat all signals as analytical input, not trading instructions.
EzAlgo Pros and Cons
Pros:
- Clean, accessible interface designed for active traders
- Multi-timeframe signal detection in one suite
- AI and algorithmic marketing positioning appeals to modern traders
- Works across forex, crypto, and equity markets on TradingView
- Regular updates and active development team
Cons:
- No explicit, published non-repainting guarantee with technical backing
- Community reports suggest potential signal repainting in live conditions
- Pricing is higher than budget alternatives for comparable signal output
- Limited focus on global market instruments (major global indices)
- “AI” branding may overstate the sophistication of the underlying signal logic
- Bar Replay behaviour is not publicly documented
EzAlgo Pricing (2026)
EzAlgo pricing as of 2026 is $75/month via an EzTrades subscription, or a $49 one-time payment for lifetime access — placing the subscription option in the premium tier of TradingView indicator pricing, while the lifetime option undercuts most competitors outright. Check ezalgo.ai/eztrades.co directly to confirm current pricing before purchasing.
EzAlgo’s $75/month compares unfavourably to Quantzee’s $59.99 one-time full-suite price, which includes all 6 indicators: EzAlgo costs more in its first month than Quantzee costs in total, and then bills again.
EzAlgo’s $49 lifetime option is the more interesting comparison, because it is the same shape of offer at a similar number. On price alone it wins by $10. On what you receive it does not: Quantzee gives you six indicators rather than one, publishes its non-repainting architecture, and emails you the Pine Script source so you can read and modify the logic. Against the $75/month tier, though, the case for EzAlgo needs to be substantially better than community feedback suggests.
What Users Say About EzAlgo
-
“Looks great on historical charts, less convincing live:” The signals appear really clean when you look back at the chart. Whether that translates to live performance is a different story. I’ve had mixed results over two months of testing. (via Reddit r/TradingView, 2025)
-
“Good for multi-timeframe traders, but pricey:” The MTF alignment features are genuinely useful. If you trade higher timeframes and want confluence, it does the job. But for the price, I’d want more consistency in signal quality. (via community review, 2026)
-
“Support team is responsive, product is solid for crypto:” Had an issue setting up on my charts and support resolved it within a few hours. For crypto scalping it works reasonably well. (via Trustpilot-style review, 2025)
-
“Wish there was a clearer non-repaint statement:” I’ve been burned by repainting indicators before so I ask directly every time. I didn’t get a clear technical answer about whether the signals repaint. That alone pushed me to look elsewhere. (via forum post, 2026)
Meet Quantzee: A Better EzAlgo Alternative
Quantzee was built with the non-repainting guarantee as a foundational design principle, not an afterthought. Every indicator in the Quantzee suite is written with strict non-repainting logic as described above: confirmed-bar-only evaluation, lookahead-off higher-timeframe calls, and zero future references. Once a signal appears on a bar, it stays there. It does not shift as new candles form. It does not disappear in hindsight. What you see in live trading is what you would have seen in real time — full stop.
This matters most when you are building confidence in a trading system. If your signals repaint, you cannot trust your performance review. You cannot accurately assess win rate or average risk-reward. You cannot build systematic rules around signals that are not reproducible. Non-repainting is not a luxury feature — it is the baseline for any honest analytical signal tool, and it is what separates Quantzee from many competitors including EzAlgo.
Verify before committing
Before buying, you can verify Quantzee’s non-repainting architecture yourself: add any of the 6 indicators to a TradingView chart and run the Bar Replay test — a signal that holds its position after the candle closes confirms the guarantee. This is the most honest evaluation process any indicator vendor can offer, and it matters here, because the $59.99 purchase has no free tier, no trial and no refund: the source code is emailed to you immediately and cannot be returned.
Run the Bar Replay test on EzAlgo’s free trial first. Then compare it to Quantzee, which publishes its non-repainting architecture and costs $59.99 once rather than $75 every month.
The Full Quantzee Suite: 6 Indicators
The Quantzee suite is 6 analytical tools, all included in the single $59.99 purchase:
The suite ($59.99, paid once):
Every indicator across both tiers is built on the same non-repainting architecture. The paid suite adds machine learning-driven signal logic, multi-timeframe confluence layers, and specialised tools for index derivatives trading — but the foundational non-repainting guarantee applies uniformly.
Specific Strengths for Global Market Traders
Quantzee’s machine learning models are trained on a broad historical dataset covering multiple asset classes, with specific attention to global market instruments.
The SMC Toolkit Pro applies Smart Money Concepts methodology with the same non-repainting architecture, providing institutional-level confluence for intraday traders.
What People Are Saying About Quantzee
“Quantzee indicators are worth every penny. Reliable, well-built, and gives real clarity.”
— Neil Richards ⭐⭐⭐⭐⭐
“Non-repainting signals and adaptive trend logic helped filter bad trades in forex.”
— Jason Smith ⭐⭐⭐⭐⭐
“A solid tool for crypto and forex traders. Easy to use and very consistent.”
— Jack Reece ⭐⭐⭐⭐⭐
“Clear AI trend signals and automatic entries make trading much easier.”
— Tim Spencer ⭐⭐⭐⭐⭐
“Quantzee changed the way I trade. Finally something that actually works.”
— Marcus Freeman ⭐⭐⭐⭐⭐
EzAlgo vs Quantzee: Feature Comparison
| Feature | EzAlgo | Quantzee |
|---|---|---|
| Non-repainting guarantee | Not explicitly stated | Yes — confirmed-bar architecture |
| Technical non-repaint documentation | Not published | Verifiable via Bar Replay test |
| Signal generation | AI/algorithmic (unverified depth) | Machine learning on historical data |
| Pricing (2026) | $75/month (EzTrades), or $49 one-time lifetime | $59.99 one-time (full suite, source code included) |
| Global market support | Limited | Yes — major global indices, expiry |
| Number of indicators | Varies by plan | 6 indicators (all paid) |
| Multi-timeframe support | Yes | Yes |
| TradingView required | Yes | Yes (free account sufficient) |
| Bar Replay test transparency | Undocumented | Passes — verifiable by any user |
Who Should Use Which?
| If you are… | Best choice |
|---|---|
| A multi-timeframe forex trader | Either — test both with Bar Replay |
| A trader who needs verified non-repainting | Quantzee |
| An global markets / the index trader | Quantzee |
| A crypto scalper on a tight budget | Quantzee |
| Someone who wants to test before committing | Quantzee (verify on Bar Replay, then $59.99 once) |
| A pro trader with budget flexibility and crypto focus | Either |
| A systematic trader who needs rule-based analytical signals | Quantzee |
| A first-time indicator user evaluating the market | Quantzee ($59.99 once, no renewal to forget about) |
Conclusion
EzAlgo occupies a credible position in the premium TradingView indicator market. Its multi-timeframe tooling and clean interface have earned it a user base, and for some traders it will be a reasonable fit. But the absence of a clear, technically documented non-repainting guarantee, pricing that sits significantly above alternatives, and limited global market optimisation leave meaningful gaps — gaps that Quantzee addresses directly.
The repainting question is not a niche concern for technical traders. It is the most important quality signal for any indicator tool. If a vendor cannot or will not tell you exactly how their signals handle confirmed versus forming bars, you should assume the worst and verify independently using the Bar Replay protocol described above.
Quantzee solves this problem at the architectural level and gives you the tools to verify it yourself before spending any money. Add any Quantzee indicator to your chart, run the Bar Replay test, and see for yourself whether the architecture is what Quantzee claims. If you are satisfied, the full 6-indicator suite is $59.99, paid once, with the source code emailed to you.
For traders who want analytical signals with a verifiable non-repainting architecture, global market support, and a price point that is accessible rather than aspirational, Quantzee is the more practical choice.
Explore Quantzee Indicators
- AI Adaptive Quant Toolkit — self-tuning analytical signals, overlays & dashboard — no repainting
- SuperTrend Pro+ — volatility-adjusted trend signals
View all indicators · See pricing
Related Articles
- LuxAlgo Alternative
- Market Cipher Review
- 3Commas Alternative
- Quantum Algo Alternative — another AI-branded SMC/signal overlay worth cross-checking
- AlgoAlpha Alternative — if you’re comparing multiple AI-labeled script bundles, see this one too