Adaptive AI
Oscillation Engine
A unified AI-driven framework for momentum, liquidity, and reversal intelligence.
The QuantZee Adaptive AI Oscillation Engine is an advanced, all-in-one oscillator that brings together multiple analytical layers — smart money flow, hyper-wave momentum, real-time divergence mapping, volume-based reversal detection, and confluence visualization — to give traders a complete picture of trend strength, exhaustion, and potential reversals.
Unlike conventional oscillators that rely on fixed mathematical relationships, this engine adapts dynamically to volatility, market rhythm, and liquidity changes.
It analyses the underlying psychology of buying and selling pressure, converts that into color-coded visual intelligence, and helps users anticipate shifts before they appear on price.
You can think of it as a market cognition system — observing, reasoning, and adapting — turning complex data into a clear directional bias.


How It Works
At its core, the engine continuously evaluates momentum behaviour, money flow direction, and volume participation.
When these forces align, it builds a strong confluence that represents a high-probability market condition — bullish or bearish.
When they diverge, the system detects imbalance, showing early signs of weakening trends or upcoming reversals.
This adaptability makes it equally powerful during both trending and ranging markets — where one set of components focuses on trend continuation and another on mean-reversion setups.

Main Components
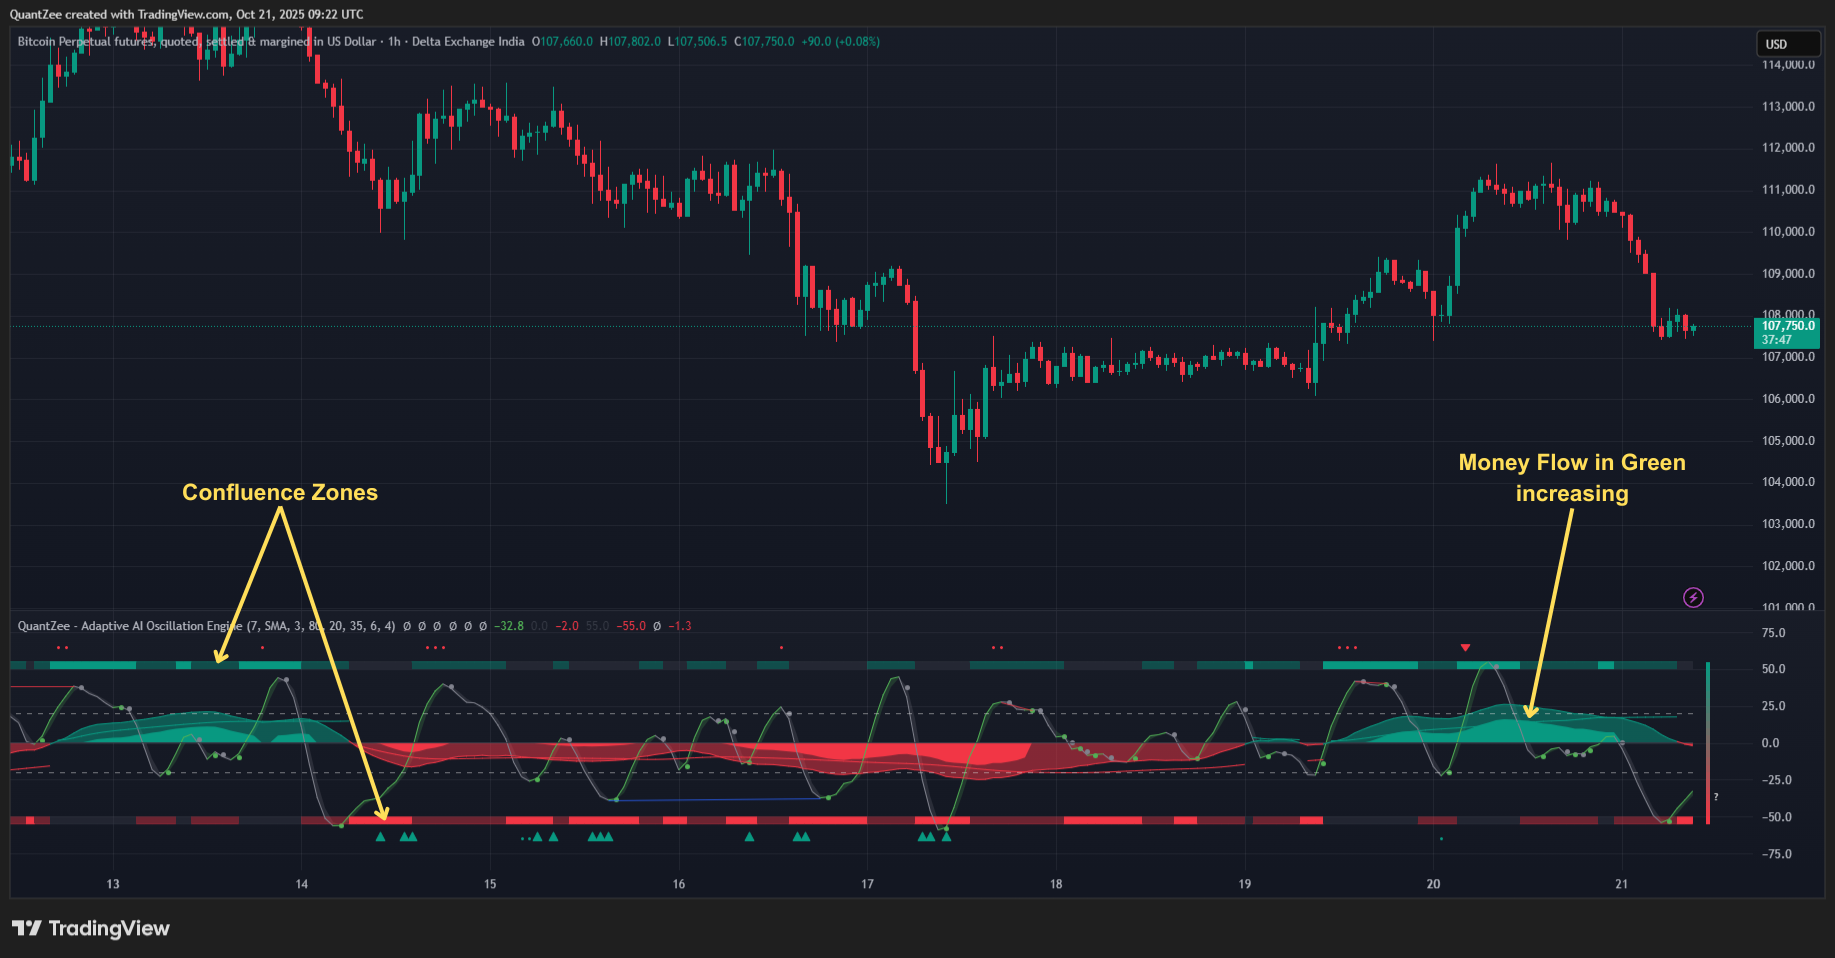
1. Smart Money Flow (Liquidity Map)
Visualizes how buying and selling liquidity enters the market in real time.
The green and red waves represent where institutional and retail pressure is accumulating or fading.
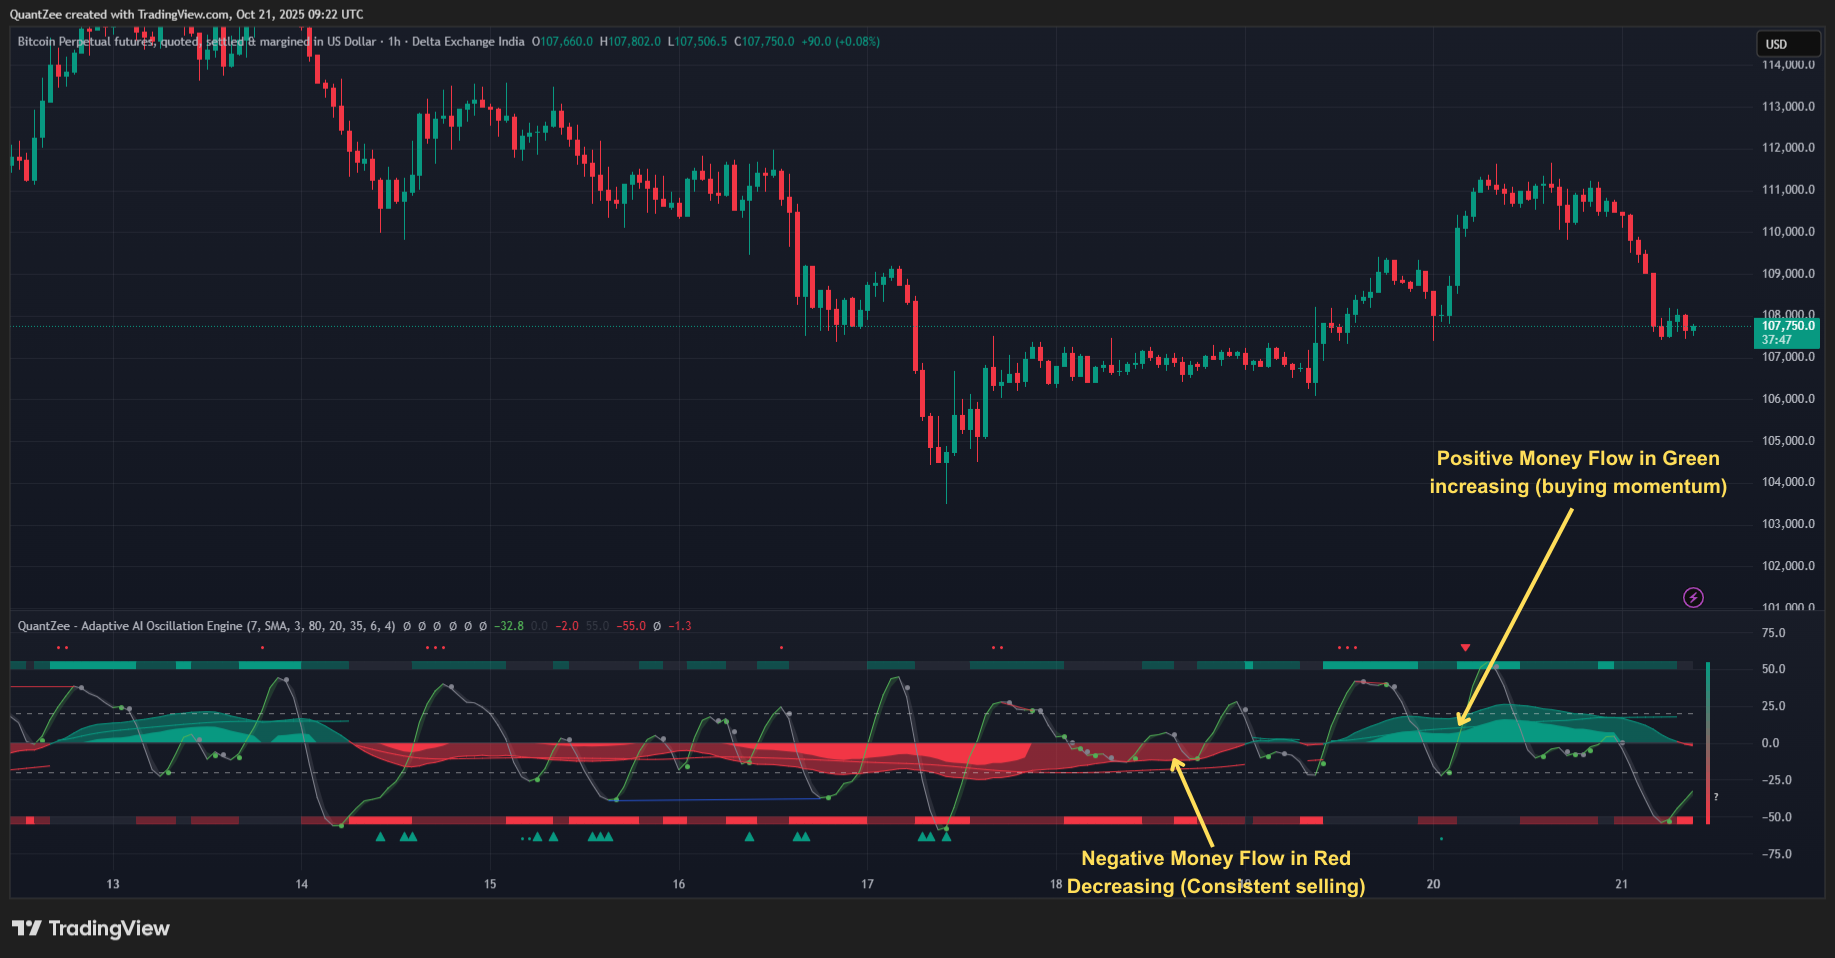
- Positive Money Flow (Green): Genuine buying momentum, strong accumulation zones.
- Negative Money Flow (Red): Consistent selling, distribution phases.
- Threshold Lines: Adaptive boundaries that highlight when the flow reaches statistically high or low activity levels.
When money flow expands rapidly but price fails to progress, the system labels it as potential “Overflow” — a state of over-participation often preceding trend exhaustion.
2. Overflow & Threshold Analysis
The lighter waves within the money flow band indicate overextension — moments when traders are chasing late moves.
These regions are crucial to spot buyer/seller exhaustion.
When Overflow appears near the upper threshold after an extended run, it signals an environment ripe for a short-term pullback or major reversal.
Conversely, Overflow near the lower threshold during panic selling often precedes sharp recoveries.
3. Hyper-Wave Oscillator (Momentum Engine)
A dynamically smoothed oscillator ribbon that adjusts to volatility and trend phase.
- Green/Gray Ribbon: Shows which side (bullish/bearish) currently controls momentum.
- Crossover Points: Mark subtle phase transitions where trend energy shifts.
- Separation Width: Indicates the intensity of current directional drive.
Users can choose between SMA or EMA smoothing depending on whether they prefer a steadier or more reactive momentum read.
The Hyper-Wave also serves as the base for the Real-Time Divergence AI, giving predictive power on short and long cycles.
4. Real-Time Divergence AI
Traditional oscillators often lag or repaint divergence signals.
The Adaptive Engine solves this by mapping oscillator and price extremes as they form — identifying imbalance immediately.
- Bullish Divergence (Blue Lines): Price makes a lower low, but oscillator refuses to confirm → weakening sell pressure.
- Bearish Divergence (Red Lines): Price makes a higher high, but oscillator momentum flattens → likely distribution phase.
The Divergence Sensitivity control lets traders focus on either shorter-term fluctuations or larger structural imbalances.
5. Volume-Based Reversal Engine
Reversal points are weighted by real trading volume.
The system filters out false turns and highlights only statistically meaningful shifts.
- Major Reversal (Triangles): Occur when price, momentum, and volume align for a potential large-scale change.
- Minor Reversal (Small Circles): Highlight micro-rotations or early trend slowdowns.
By comparing live volume against its moving average, the engine gauges whether market participation is intense enough to confirm a genuine pivot.
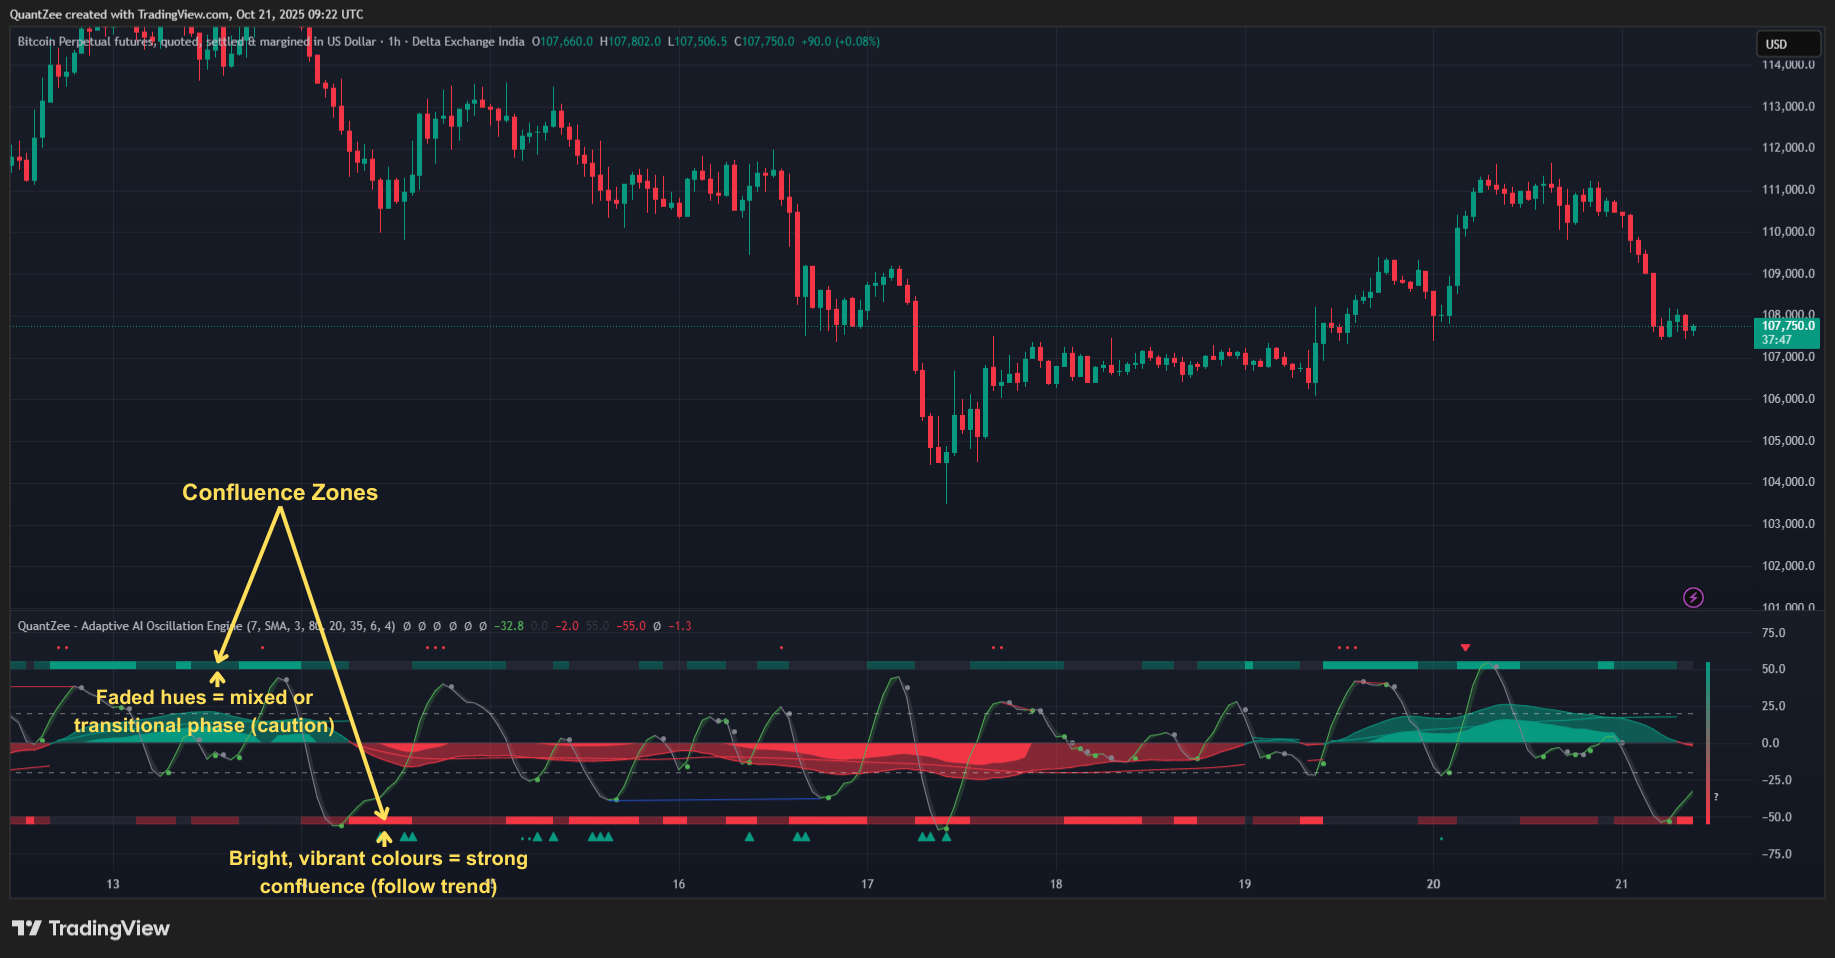
6. Confluence Zones
When the Hyper-Wave oscillator and Smart Money Flow move in the same direction, the panel displays clear bullish (green) or bearish (red) zones.
These Confluence Zones visually map how strongly both systems agree:
- Bright, vibrant colours = strong confluence → follow trend.
- Faded hues = mixed or transitional phase → caution.
This helps traders focus on periods when multiple indicators align, reducing emotional noise.
7. Adaptive Confluence Meter
At the right edge of the chart, a dynamic meter shows the real-time sentiment level across all layers:
- +40 / +20 → Bullish momentum and flow alignment.
- 0 → Neutral / indecisive.
- −20 / −40 → Bearish consensus.
It updates bar-by-bar, providing a continuous snapshot of market mood and trend coherence.
Interpreting the Engine
A good workflow for reading the Adaptive AI Oscillation Engine:
- Start with Confluence:
Is the meter strongly positive or negative? A strong bias often aligns with continuation setups. - Check Money Flow Context:
Is liquidity supporting the trend or fading away? Overflow means possible exhaustion. - Confirm with Hyper-Wave:
Momentum crossovers validate the strength or weakness of that move. - Watch Divergences & Reversals:
When real-time divergence appears alongside major reversal markers, prepare for potential shift.
Assess Volatility:
If confluence is mixed or meter swings around zero, expect range-bound or noisy price action.
Practical Scenarios
Scenario 1: Weak Selling, Early Reversal
A large bullish reversal triangle appears at the bottom of the panel while Money Flow remains far from its negative threshold.
Interpretation: No genuine selling pressure → high chance of rebound.
Scenario 2: True Buying Surge
Money Flow rises in sync with the Hyper-Wave ribbon turning green.
This double confirmation signals real accumulation and likely continuation.
Scenario 3: Buyer Overflow
Lighter micro-waves appear in the Money Flow; soon after, a red reversal marker prints.
Meaning: buyers overextended → prepare for a pullback.
Scenario 4: Mixed Zone
Bright green zones fade while the meter drops to +10 or 0 — caution phase.
The market is transitioning; reduce risk or wait for clarity.
Scenario 5: End of Downtrend
After prolonged red flow, the Confluence Zone brightens green and a major bullish reversal triangle forms.
This combination often precedes sharp recoveries.
Navigating Market Phases
- Trending Markets: Focus on the Hyper-Wave + Confluence Zones for continuation signals. Ignore early reversals unless divergence confirms exhaustion.
- Ranging Markets: Use minor reversals + divergence to trade inside boundaries. Keep expectations modest.
- Volatile Conditions: Let the Confluence Meter reset. Wait for it to sustain a bias beyond ±20 for confirmation.
Using the Indicator Effectively
✅ Analyse Smart Money Flow first, then use oscillator and reversal cues to confirm.
✅ Combine divergence + confluence for best accuracy.
✅ Treat reversal shapes as warning signals, not mechanical entries.
✅ Wait for meter alignment before acting on any bias.
✅ The system works best when integrated with your existing price structure and strategy.
Key Inputs and Customisation
- Oscillator Settings:
1. Length (5–21)
2. Type (SMA or EMA)
3. Smooth Factor (2–10)
4. Divergence Sensitivity (20–40) - Money Flow Settings:
1. Length (10–55)
2. Smooth (2–10)
3. Color Schemes (Customisable) - Reversal Engine:
1. Reversal Factor (1–10)
2. Enable/Disable Toggle
3. Major/Minor Visualization - Confluence Controls:
1. Zone Display
2. Side Meter Display
3. Adaptive Colors
Each parameter can be tuned to align with your timeframe, risk preference, and trading style.
Why Traders Use It
- To detect trend exhaustion before price reacts.
- To verify liquidity participation behind breakouts.
- To spot early divergences without lag.
- To see confluence clearly instead of juggling multiple indicators.
To adapt across market regimes — trending, ranging, or volatile.
Conclusion
The QuantZee Adaptive AI Oscillation Engine transforms how oscillators are perceived.
It’s not just a momentum tool — it’s an AI-adaptive decision framework that merges price behaviour, liquidity pressure, and volume context into one coherent system.
Designed for traders who value confluence over confusion, it offers a structured yet flexible approach to understanding market dynamics — helping you stay one step ahead, with clarity and confidence.
CPR Theta Engine FAQ
It’s a TradingView indicator built for high-probability option selling using Central Pivot Range (CPR) logic. It automatically identifies optimal setups to sell Calls, Puts, or Iron Condors based on CPR-based price positioning.
Yes, it is optimized for index options due to:
- CPR’s high relevance in index movement,
- Iron Condor suitability for range-bound days,
- Customizable spread width and strike rounding compatible with Indian derivatives tick sizes.
Yes, This indicator always gives the signal with the hedge. You should always use hedge while using this script.
You can apply the same script across multiple TradingView charts (NIFTY, SENSEX, RELIANCE etc).
Each will:
- Auto-calculate its own CPR and strike logic,
- Maintain instrument-specific strike rounding and logic zones.
Yes, you can select custom timeframes and apply the strategy to both intraday and weekly positional setups
Yes. It simplifies the decision-making process using visual cues and rule-based logic while allowing deeper customization for advanced users.
Yes. Use the custom settings to restrict the backtest range or apply the indicator to different instruments like NIFTY, BANKNIFTY, or FINNIFTY.